Identify at-risk students in Moodle with early warning indicators
Board Retention helps teachers and coordinators identify early academic risk signals using Moodle data on activity, progress, performance and engagement.
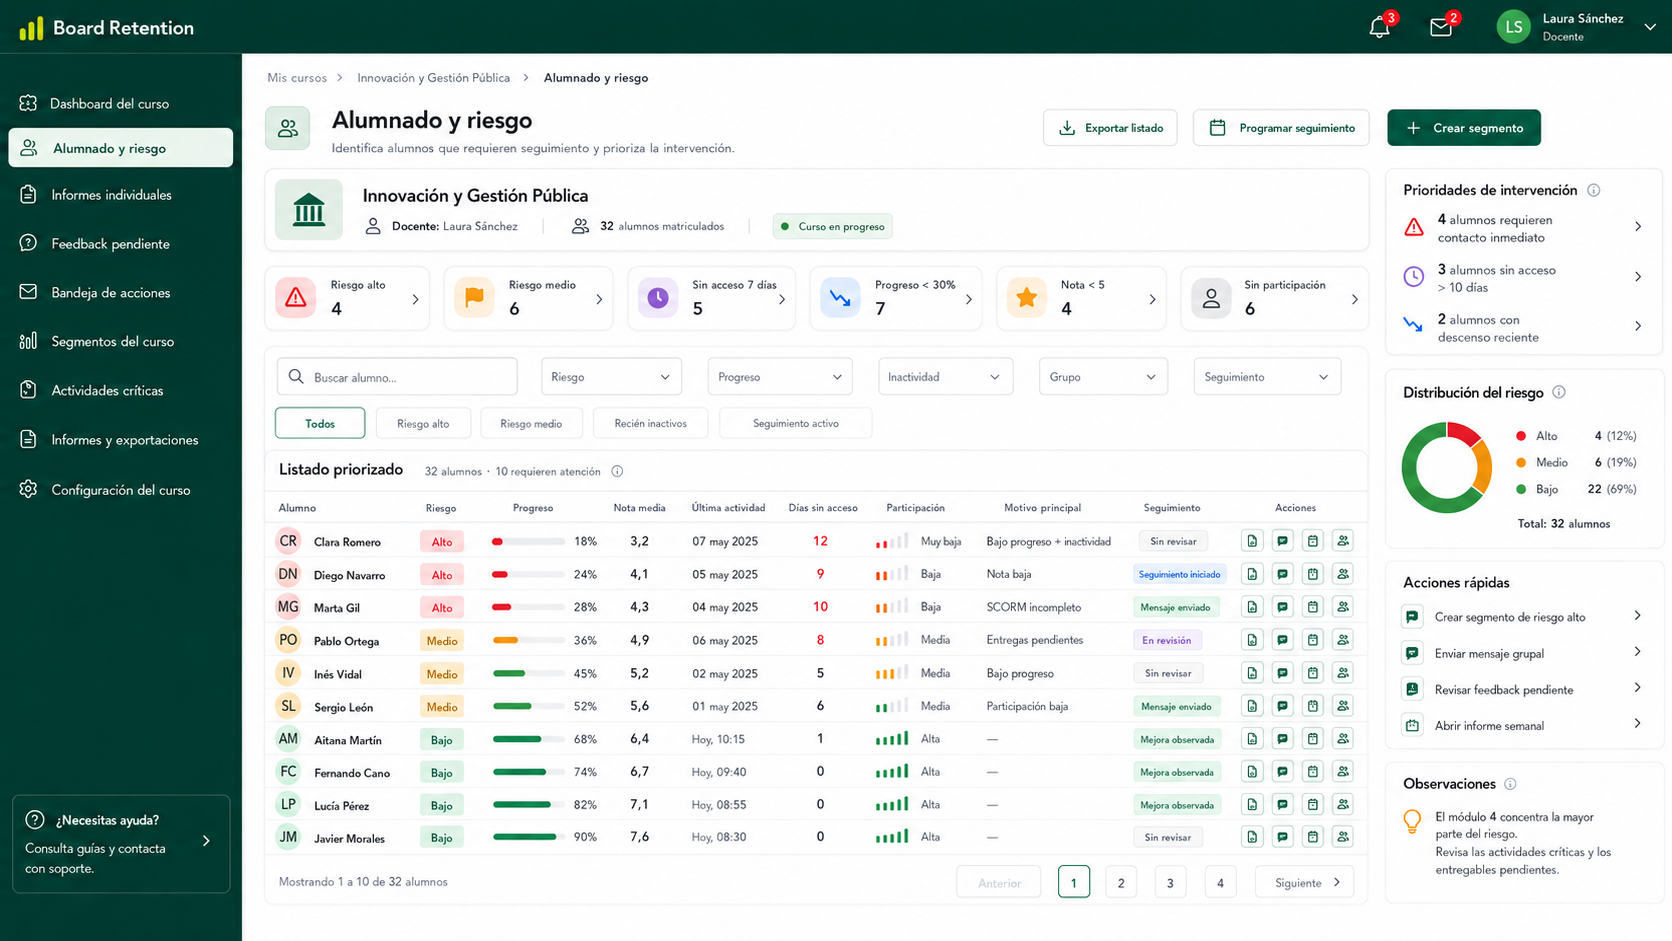
Listado accionable con indicadores de riesgo, progreso y última actividad por alumno.
Why at-risk students often go unnoticed in Moodle
The problem is not lack of data, but data dispersion, teacher workload, and late detection.
Moodle contains valuable data, but it is spread across activities, grades, completion, SCORM, engagement and feedback. Teachers often detect risk late, when delays have already accumulated and intervention becomes harder.
Data scattered across features
Moodle contains valuable data, but it is spread across activities, grades, completion, SCORM, engagement and feedback. There's no unified view of risk.
Late detection of trouble
Teachers often detect risk late, when delays have already accumulated. Intervention at week 2 is far more effective than intervention at week 12.
No aggregated view
Coordinators need an aggregated view without reviewing every course manually. Without this, struggling students fall between the cracks.
Inconsistent criteria
Each teacher uses their own criteria or perceptions. Without traceable indicators, there is no consistency in risk identification across courses.
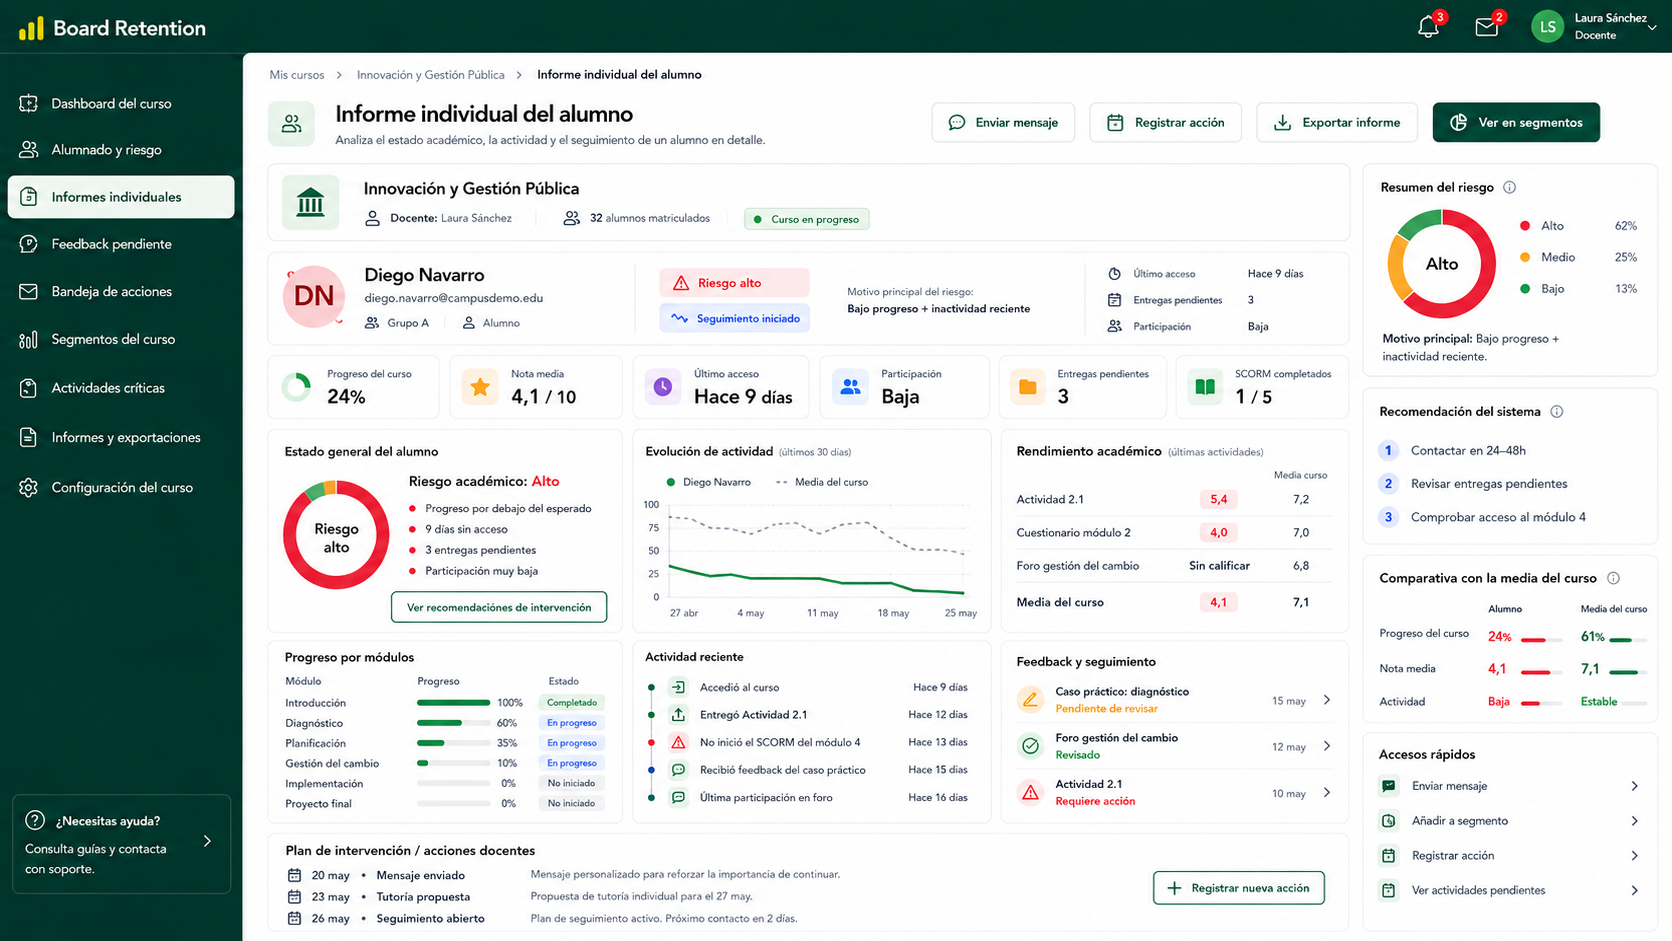
Ficha completa del alumno con progreso, notas, actividad, feedback y contexto de riesgo.
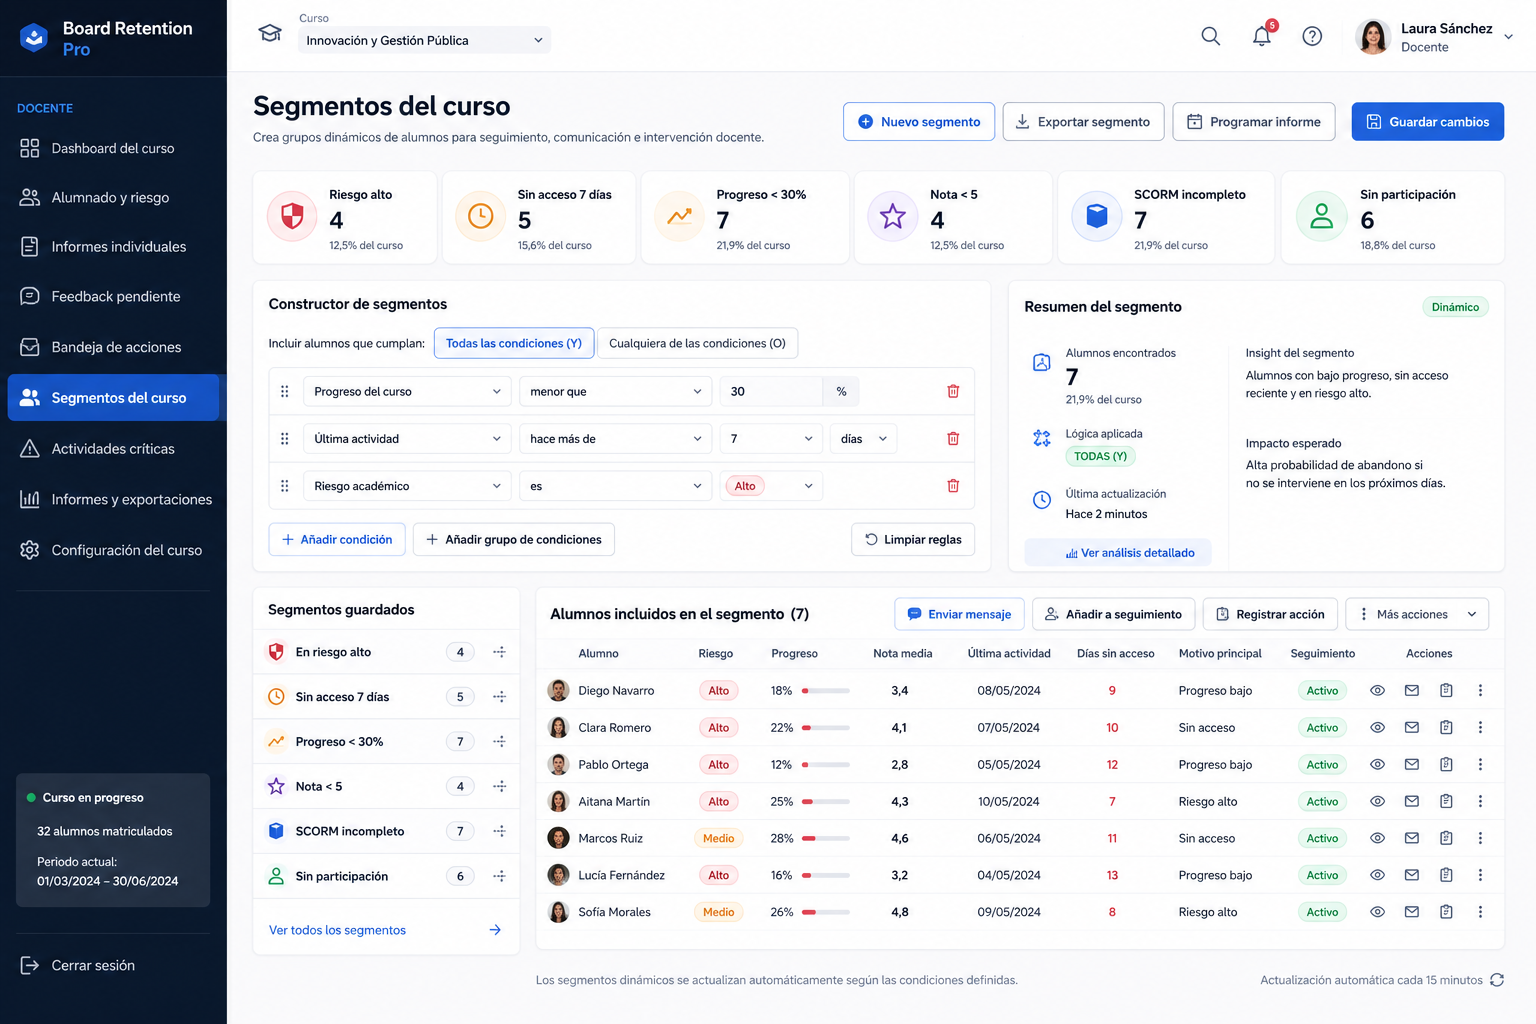
Segmentos predefinidos y constructor visual de condiciones para filtrar alumnado.
Indicators to detect academic risk in Moodle
6 signals based on observable data
Board Retention monitors indicators that reflect changes in student academic behavior. They are signals to help prioritize interventions, not definitive diagnoses.
Declining activity
Reduction in logins, submissions, or participation compared to the student's expected or previous pattern.
Delays in submissions
Late or incomplete submissions on key activities, or breaking engagement rhythm.
Slower progress than expected
The student is advancing more slowly than expected versus the course calendar or their own average.
Changes in grades
Notable decline in grades compared to the student's previous performance (not just 'low grade in absolute terms').
Lack of resource engagement
Does not access readings, videos or forums that are relevant to course progression.
Unreviewed or pending feedback
Teacher has left feedback, but the student has not reviewed it or acted on it.
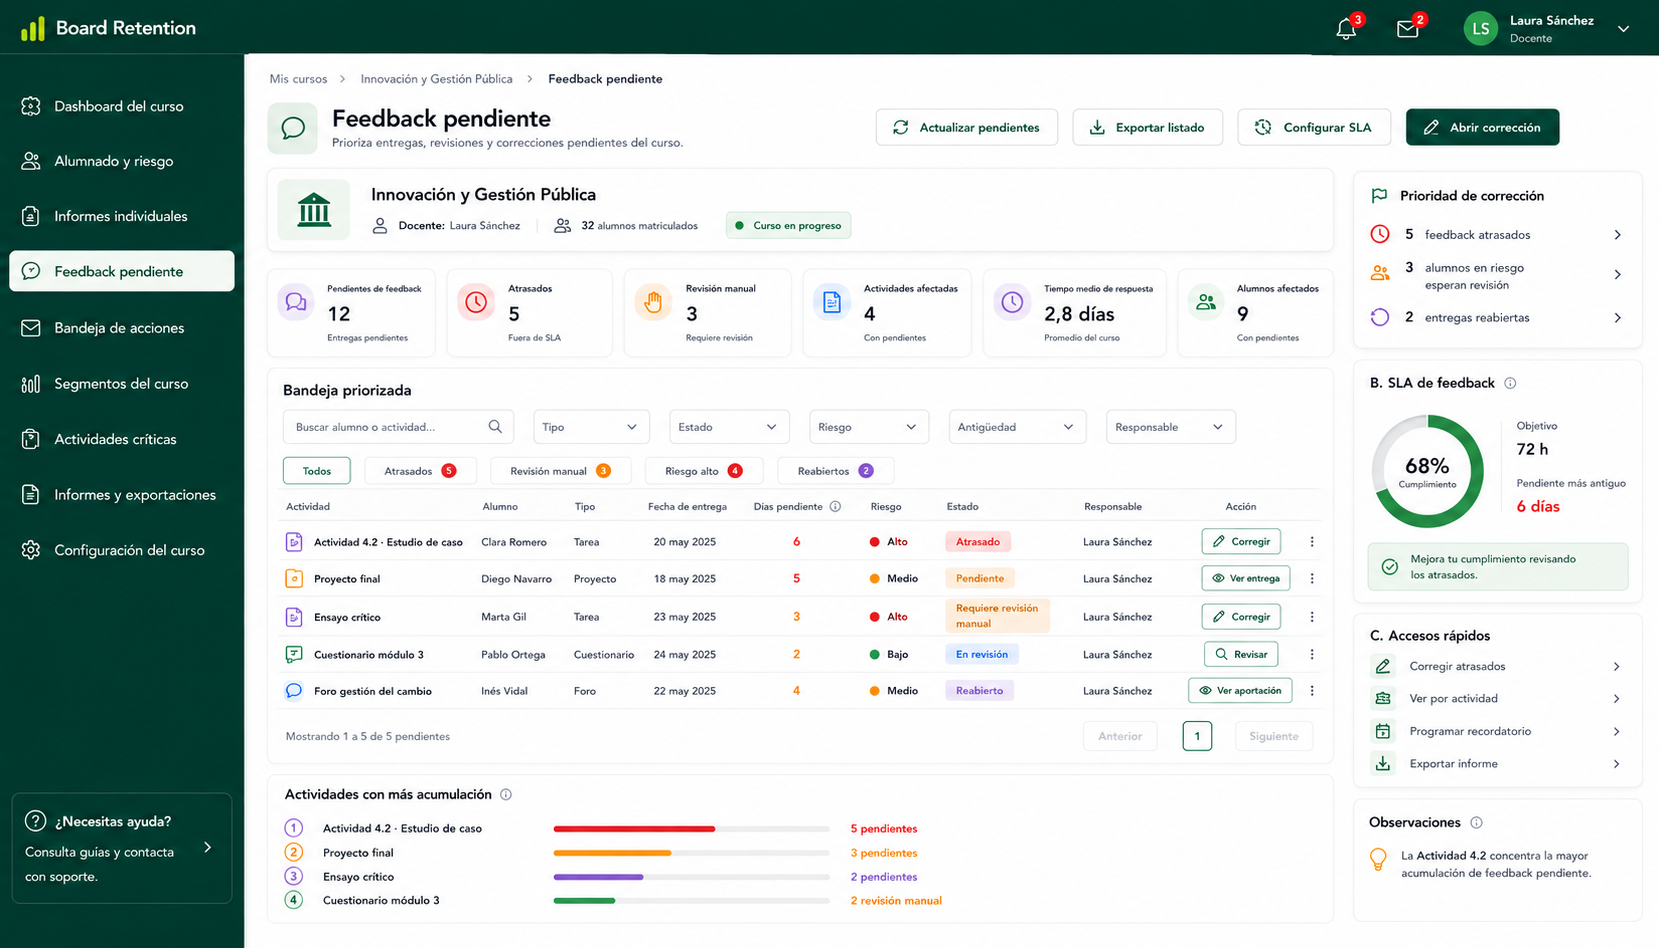
Tareas y cuestionarios pendientes de calificar, ordenados por volumen de trabajo.
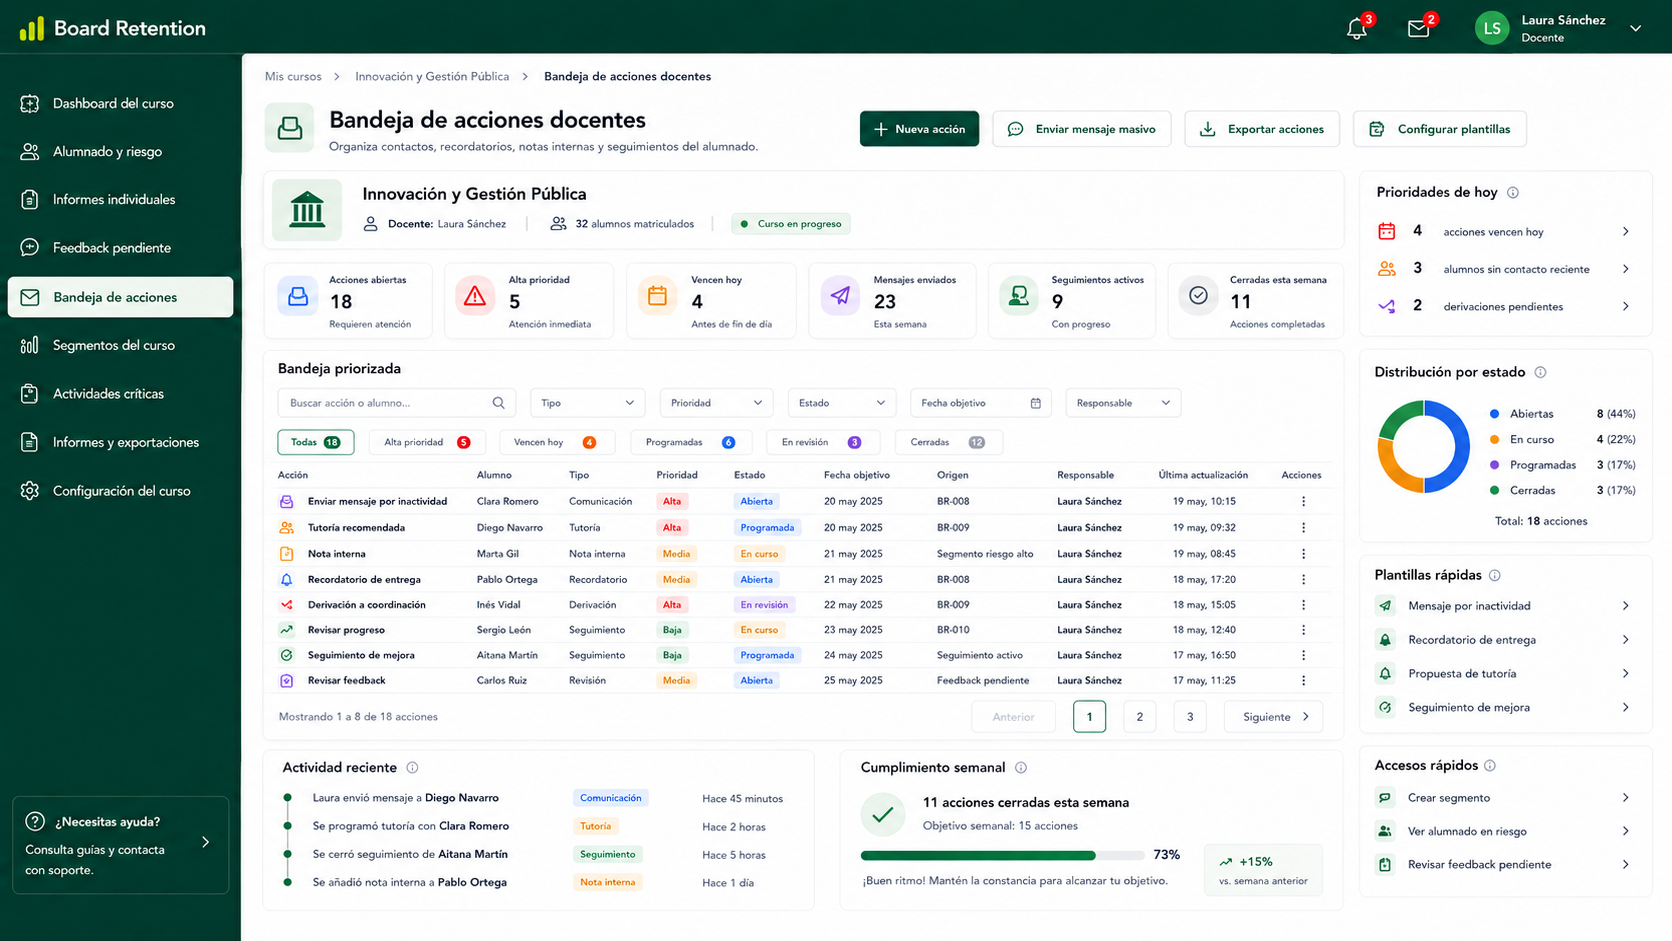
Registro de notas internas, contactos, recordatorios y seguimiento por alumno.
How early risk detection works in Board Retention
Full transparency. Traceable criteria.
The process follows a clear flow: observe data, apply criteria, compare progress, prioritize by urgency, and support action.
Observe
Collect observable Moodle indicators: completed activities, grades, logins, engagement, resource completion.
Calculate
Apply configurable criteria and thresholds. Each institution can adjust what constitutes 'risk' based on their context.
Compare
Contrast learner progress with their own previous performance and with the expected pace of the group.
Prioritize
Rank signals to support teacher review. Low risk, medium risk, high risk.
Act
Enable actions: teachers can review why a student is flagged, define interventions and track progress.
Support indicators, not automatic diagnoses
Risk signals are support indicators for teacher review, not definitive diagnoses or absolute predictions. Board Retention helps prioritize cases, but final decisions remain with the academic team, who understand each learner's educational and personal context.
Does not replace teacher judgment—it strengthens it with observable data.
Does not identify root causes (only symptoms): there may be legitimate reasons (illness, work, personal situations).
Criteria are configurable: each institution adjusts what constitutes 'risk' based on their educational model.
It is a prioritization tool, not an absolute prediction system.
Benefits for teachers, coordinators and academic leaders
Time, clarity, and action-oriented insights.
Less manual review of scattered data
Instead of scanning Moodle course by course, you receive prioritized alerts for students who need attention.
Better visibility into changes in academic behavior
See shifts in activity, progress and engagement that you might otherwise miss.
Prioritization of cases that need attention
Identify which students need intervention now, and which can wait.
Traceable and reviewable criteria
Each alert explains why a student is flagged. It's not a black box.
Support for coordination meetings
Facilitates conversations between teachers and coordinators based on data, not perceptions.
How to prioritize teacher interventions using Moodle data
3 intervention levels based on risk.
Interventions adapt to the identified risk level. From preventive outreach to escalation to student support services.
🟢 Preventive review
When early mild signals appear.
- •Short preventive email: 'I noticed you're moving a bit slow, need help?'
- •Remind of available resources (tutoring, videos, forums).
- •Invite to office hours for an informal chat.
🟡 Individual follow-up
When delays or low engagement accumulate.
- •1-on-1 meeting to understand what's going on.
- •Define a concrete plan: specific actions and follow-up dates.
- •Weekly check-in (brief email) to maintain momentum.
🔴 Coordinated intervention
When risk affects multiple indicators or courses.
- •Immediate escalation to academic coordination or student wellness.
- •In-depth conversation: Work obligations? Personal issues? Academic struggles?
- •Offer resources: intensive tutoring, counseling, special supports.
Reference scenario: risk monitoring in a training program
Higher Education Institute
200 teachers, 5,000 students, courses of 30-100 students. Year-long program with ongoing monitoring.
Figures are indicative and depend on the number of learners, courses, monitoring model and previous manual workload.
At-risk students identified
612 (12% of population)
Detected in weeks 2-4, well before manual risk assessment
Improvement in completion rate
+8%
From 82% to 90% completion, result of early interventions
Time saved
~400 hours/semester
Teachers can focus on teaching and personalized support
Indicative ROI
3x in first year
Reduction in dropout and student retention > cost of plugin
Technical specifications for Moodle risk detection
Secure, auditable and scalable infrastructure.
Moodle-based data sources
All signals are calculated from observable Moodle data: activities, grades, logins, engagement.
Read-only model
Does not modify or write data to Moodle. Only reads for analysis. Student data remains intact.
Moodle roles and permissions respected
Respects the role structure, permissions and visibility configured in Moodle. A teacher only sees their course students.
Configurable thresholds
Each institution, coordination or teacher can adjust what constitutes 'risk' based on their educational model.
Report exports
Generates exportable reports (CSV, PDF) for academic coordination and institutional tracking.
Pre-production validation
All new versions are validated in pre-production environment before moving to production.
Integration with teacher and coordination dashboards
Integrates natively with Board Retention dashboards for unified risk visualization.
Audit and traceability
Every risk decision is auditable: see exactly which criteria triggered the alert.
Frequently Asked Questions
What is an at-risk student in Moodle?
An at-risk student is one who shows changes or patterns in their activity, progress or engagement that suggest potential academic difficulties. It is not a definitive diagnosis, but a signal to help prioritize interventions.
How does Board Retention identify early risk signals?
It monitors 6 indicators: declining activity, submission delays, slower progress, grade changes, lack of resource engagement, and unreviewed feedback. It compares each student against themselves and their peer group to detect deviations.
Does Board Retention predict student dropout?
Not as an absolute prediction. Board Retention identifies early signals based on observable Moodle data, such as activity, progress, performance and engagement. These signals help teachers prioritize timely interventions, but they do not replace academic judgment.
Can teachers review or adjust risk criteria?
Yes, completely. Thresholds and criteria are configurable. Each institution, coordination or teacher can adjust what constitutes 'risk' based on their educational model and experience.
Which Moodle data is used to calculate indicators?
Observable data is used: platform logins, completed activities, grades, forum engagement, resource completion, feedback reviewed. No sensitive personal data is used.
Does the system replace teacher review?
No. Board Retention is a support tool, not a replacement. Teachers make final decisions. The system helps prioritize and see signals that might otherwise be missed.
Does it work with activities, grades, course completion and SCORM?
Yes. Board Retention integrates signals from multiple Moodle sources: activities, quizzes, assignments, grades, course completion, SCORM packages, forum engagement and resources.
Does data leave Moodle?
Risk analysis data remains within Board Retention's secure context. It is not exported to third parties. Teachers maintain full control over their students' data.
Identify early risk signals in your Moodle
See how Board Retention helps prioritize timely interventions with traceable criteria based on activity, progress and performance.