Assessment
Gradebook
Grades, categories, scales and weightings configured in Moodle to analyze academic performance.
Improve native Moodle reports with clear dashboards, actionable KPIs, interactive charts and configurable exports.
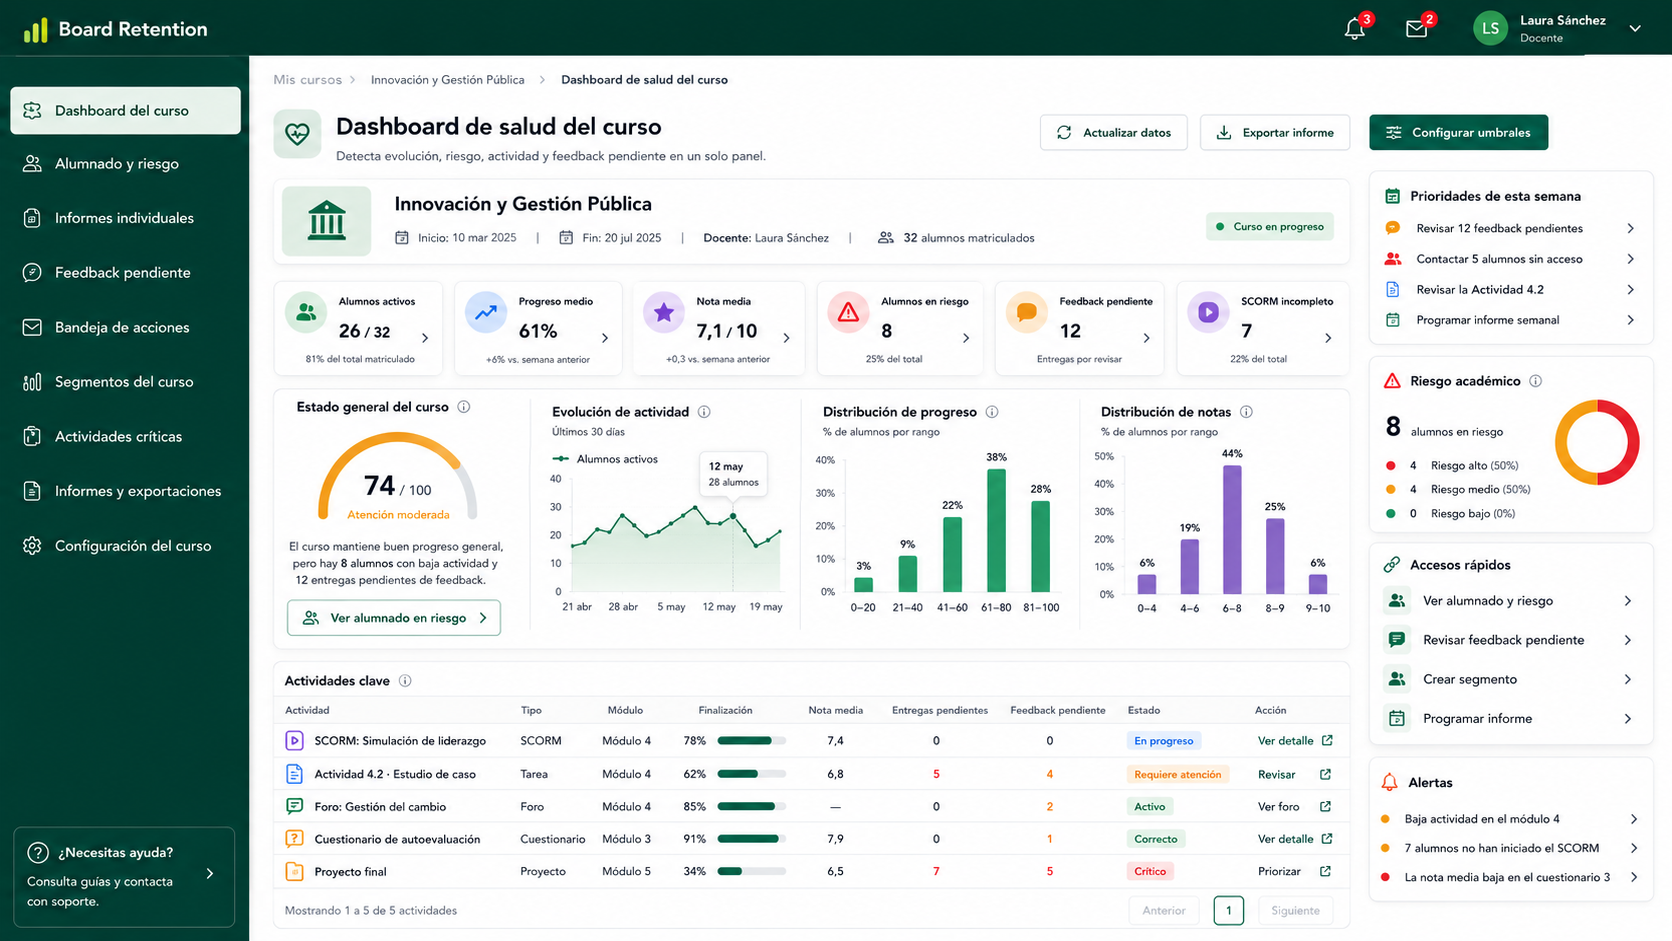
Panel único con KPIs del curso: progreso, actividad, notas, feedback pendiente y SCORM.
Board Retention does not replace native Moodle reports: it adds a visualization, prioritization and export layer designed for academic monitoring.
Location
Side-by-side comparison for each core capability.
Native Moodle
Data spread across different menus, courses and activities
Board Retention
Centralized dashboard to review key indicators from one place
Speed
Side-by-side comparison for each core capability.
Native Moodle
Review may require navigating several screens and exports
Board Retention
Optimized queries and views to reduce repetitive manual work
Visualization
Side-by-side comparison for each core capability.
Native Moodle
Tables and lists designed for specific checks
Board Retention
Dashboards, charts and visual indicators for academic monitoring
Export
Side-by-side comparison for each core capability.
Native Moodle
Manual exports depending on report type
Board Retention
Configurable exports for teachers, coordinators and academic leaders
Analysis
Side-by-side comparison for each core capability.
Native Moodle
Available data with limited cross-course context
Board Retention
Grouped KPIs, reviewable signals and context to prioritize follow-up
Operational
Side-by-side comparison for each core capability.
Native Moodle
Often reactive, once the issue is already visible
Board Retention
Earlier monitoring of changes in activity, progress or performance
Elements that turn Moodle data into clearer information for teachers, coordinators and academic leaders.
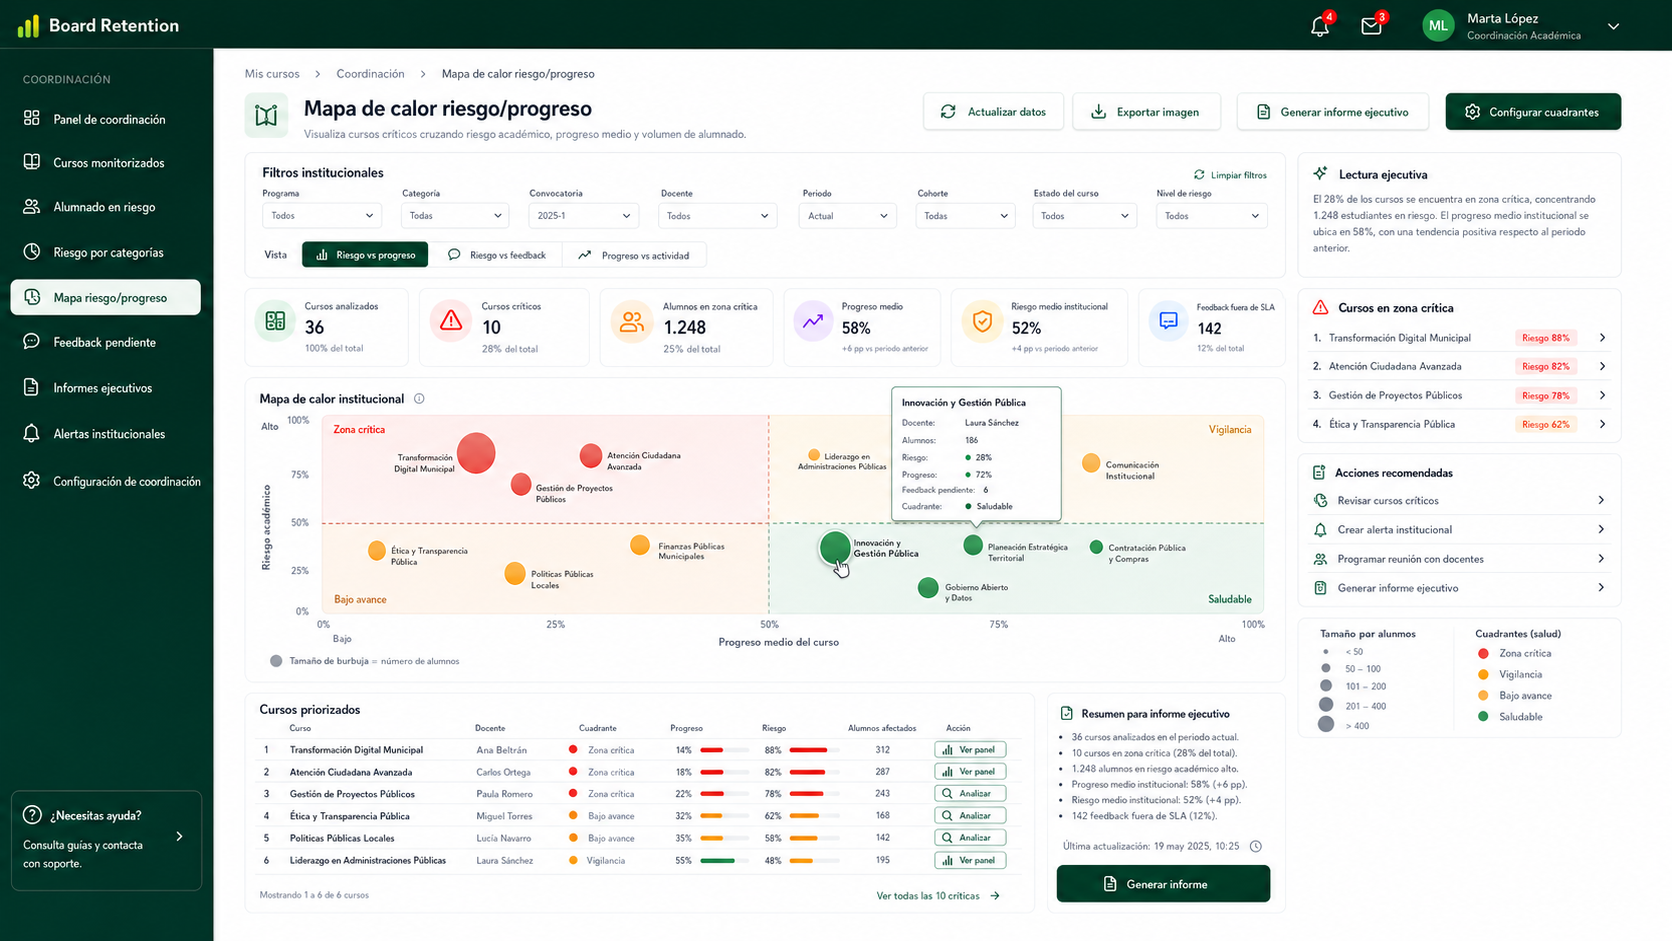
View key KPIs on progress, participation, course completion and academic performance in one screen.
Visualize progress by week, group, activity or period to identify relevant trends and changes.
Prioritized list of students with indicators that support teacher review or follow-up actions.
View activities pending review, accumulated submissions, unread feedback or tasks that need attention.
Individual overview of grades, progress, activity, participation and follow-up history.
Configurable exports for academic coordination, leadership reporting or internal follow-up.
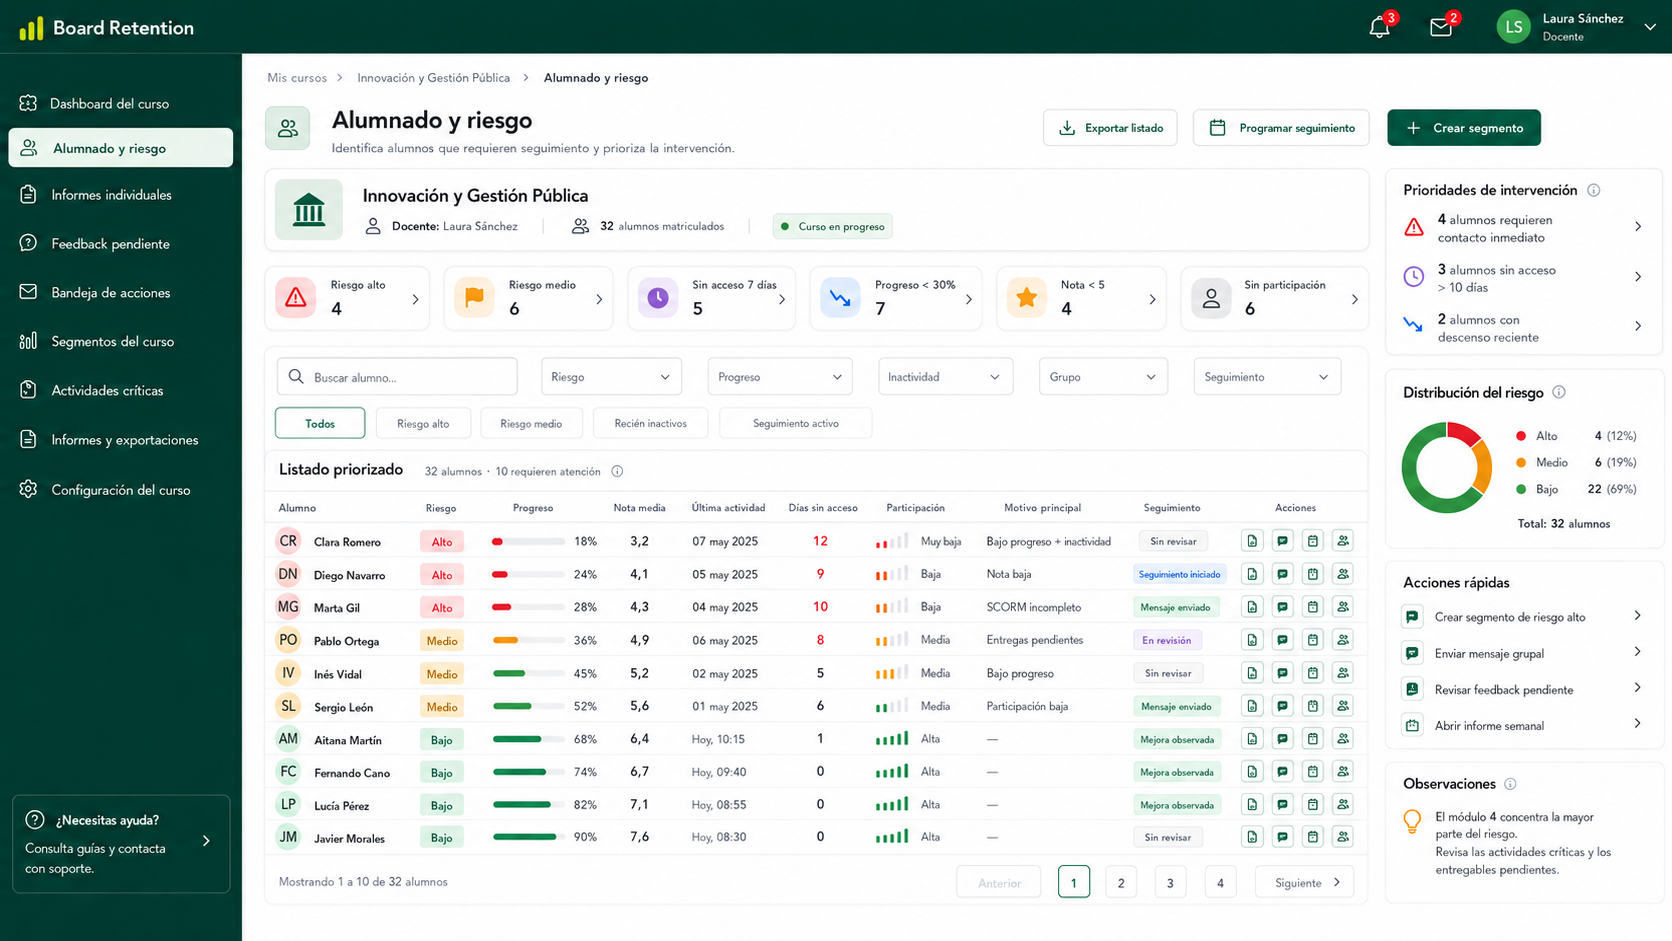
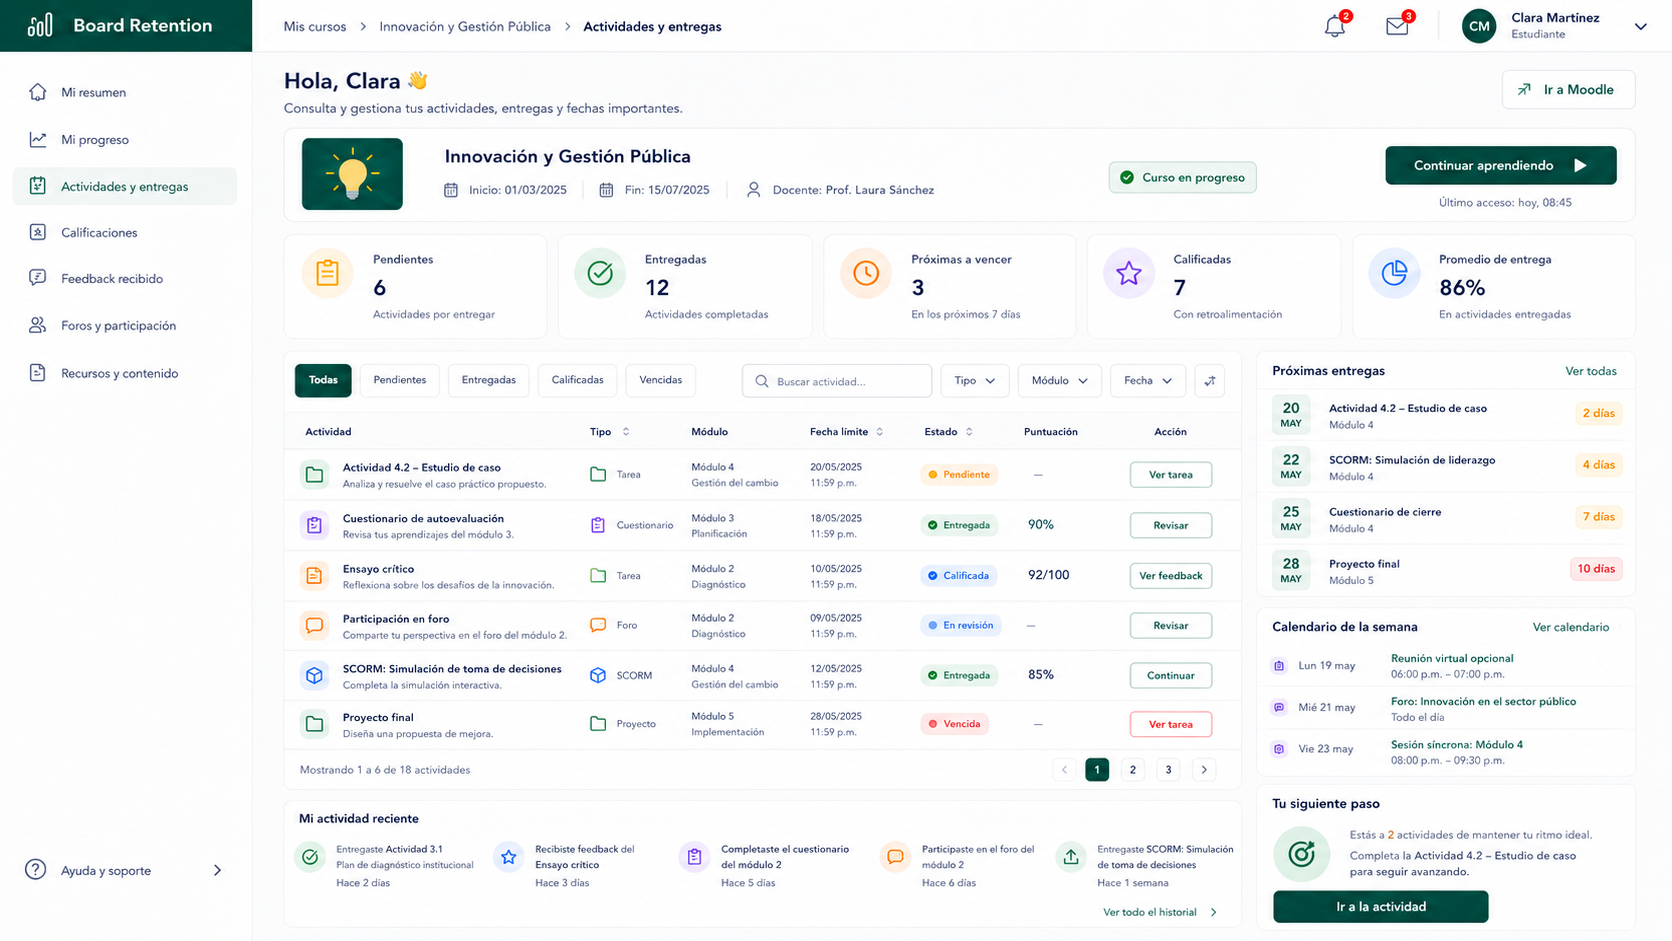
Listado accionable con indicadores de riesgo, progreso y última actividad por alumno.
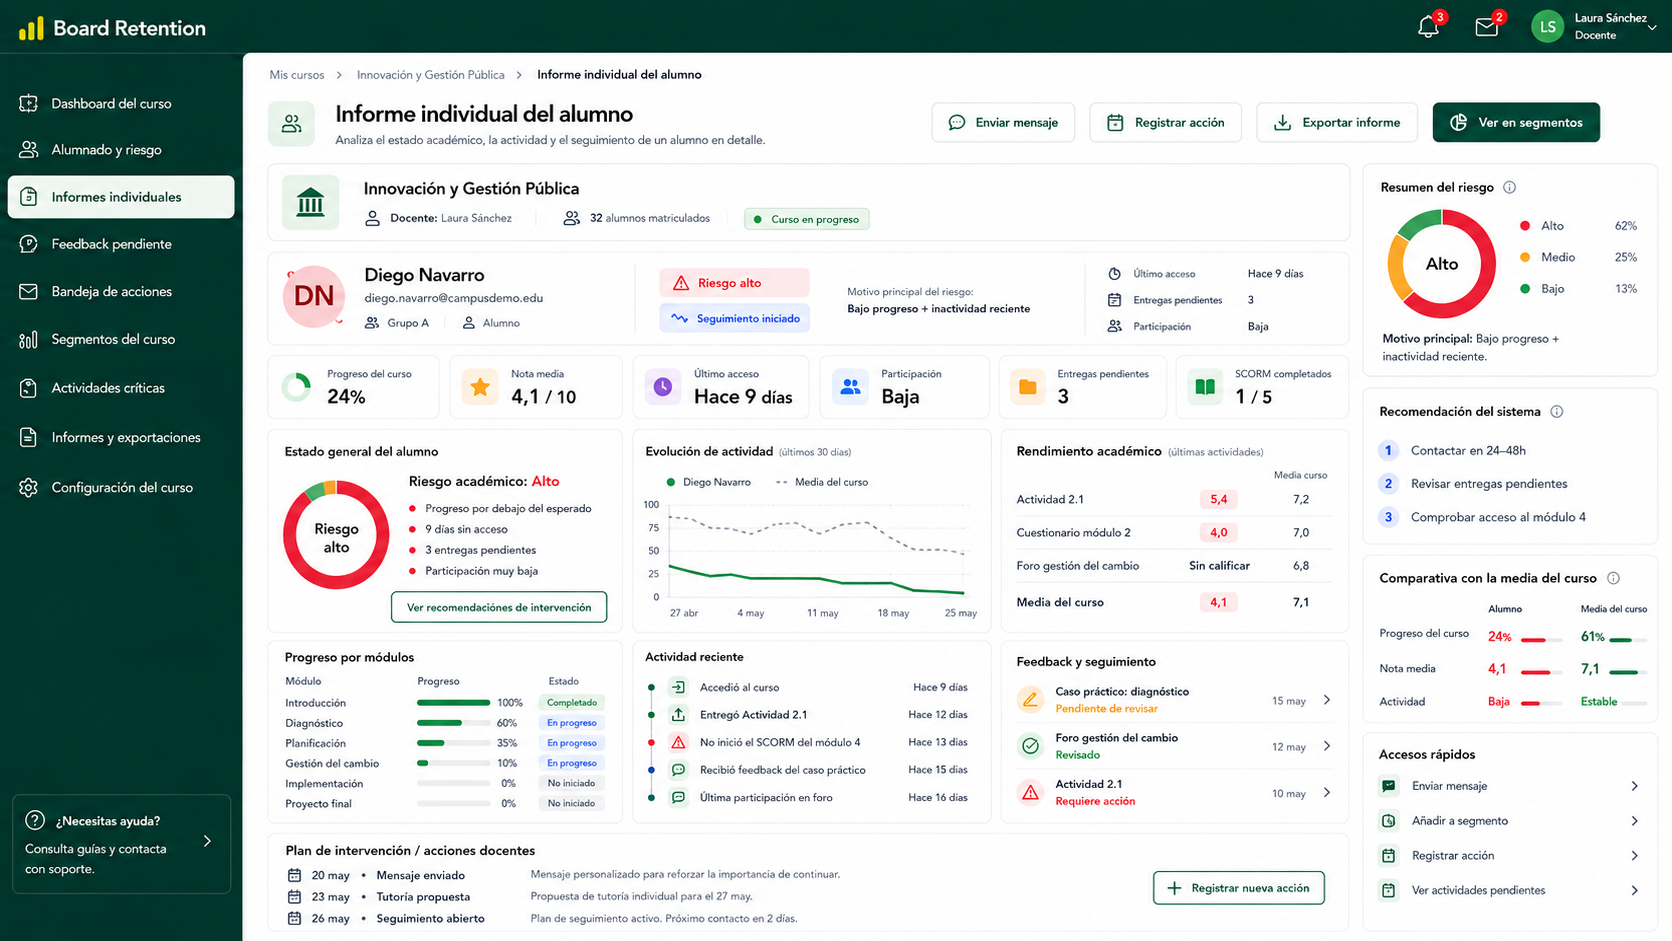
Ficha completa del alumno con progreso, notas, actividad, feedback y contexto de riesgo.
Board Retention centralizes information already available in Moodle and turns it into dashboards, KPIs and exports for teachers, coordinators and academic leaders.
Data quality
The value of any report depends on consistent Moodle configuration: course completion, grades, activities, groups, roles and monitoring criteria defined by the institution.
Assessment
Grades, categories, scales and weightings configured in Moodle to analyze academic performance.
Course
Assignments, forums, quizzes, resources, surveys and other elements used for course monitoring.
SCORM
Attempts, progress, scores and completion of SCORM content when properly recorded in Moodle.
Activity
Access events, participation and recent activity to identify changes in academic behavior.
Progress
Activity completion status, expected progress and completion criteria defined by the institution.
Context
User, group, cohort, role and enrollment information to filter reports according to responsibilities.
The solution adds a visualization, prioritization and export layer on top of existing data while respecting Moodle’s academic structure and permission model.
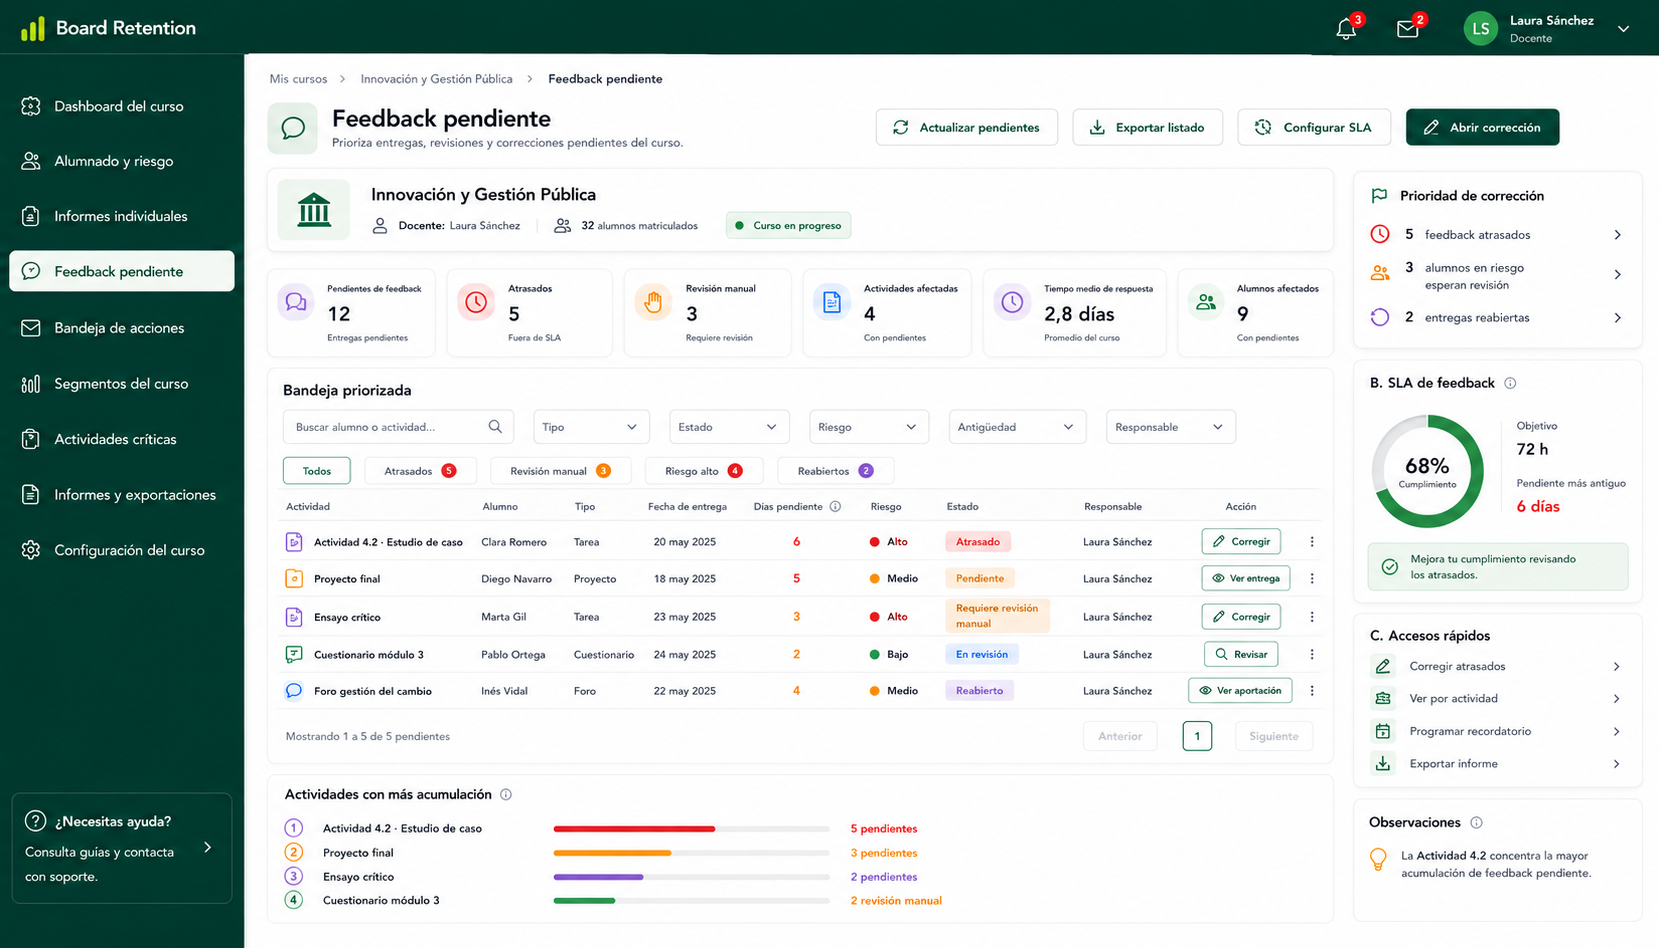
Tareas y cuestionarios pendientes de calificar, ordenados por volumen de trabajo.
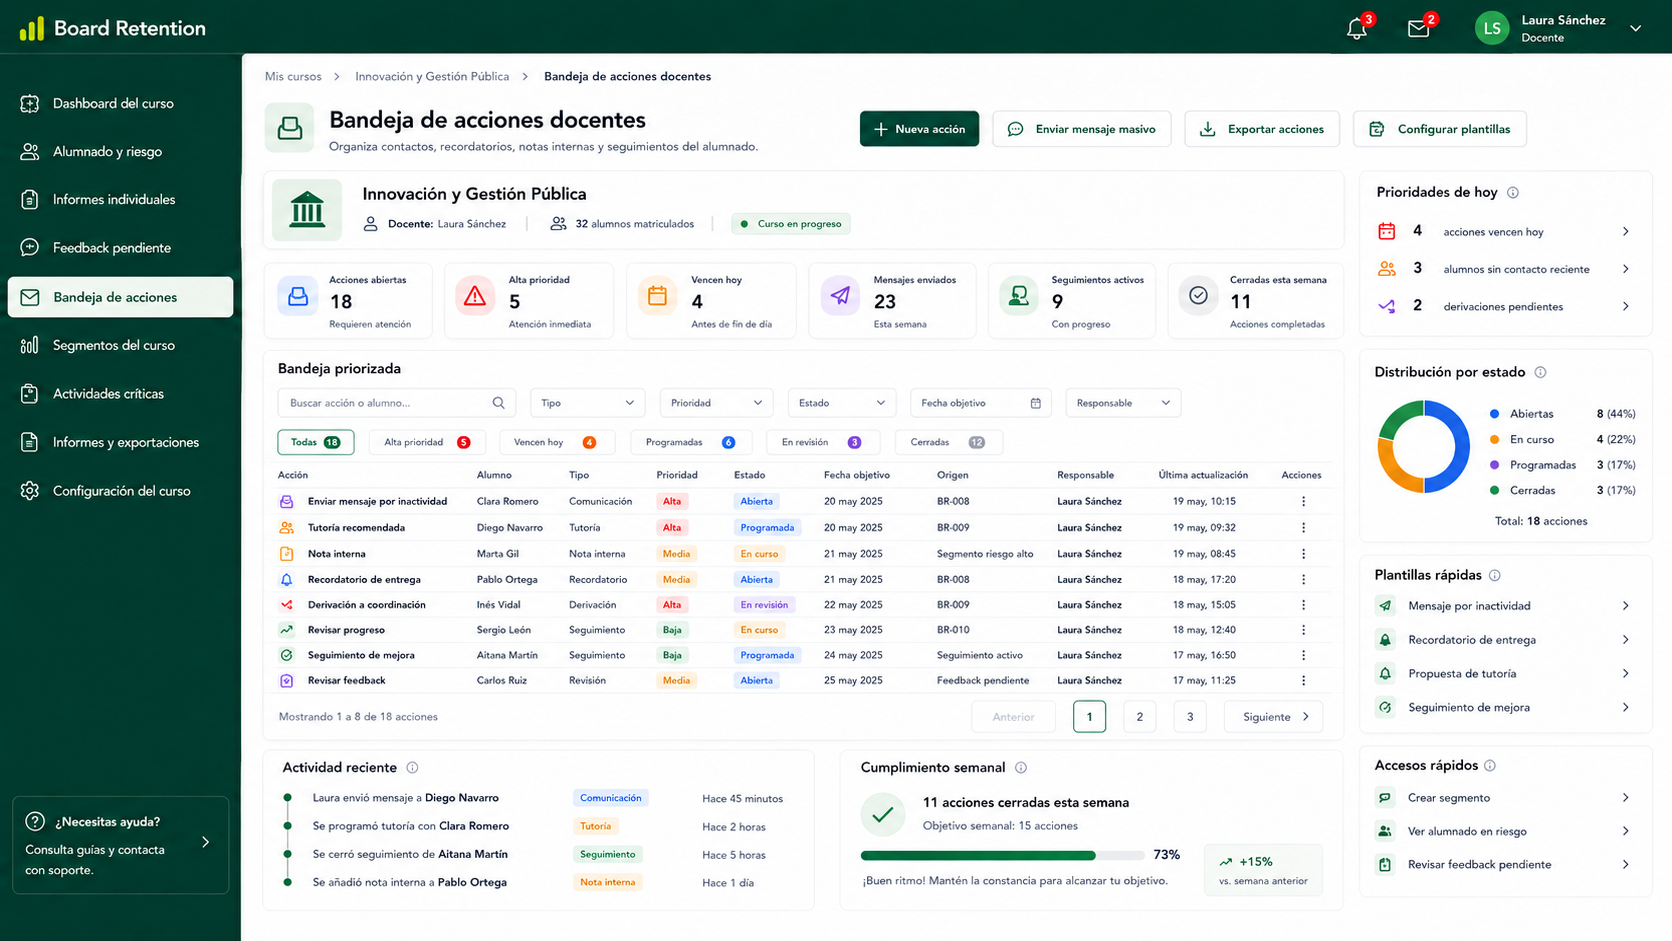
Registro de notas internas, contactos, recordatorios y seguimiento por alumno.
Common situations where Board Retention helps reduce manual work and improve academic monitoring.
Board Retention is designed to query and present indicators efficiently, reducing the need for manual calculations or repeated exports. Actual performance depends on the Moodle installation size, configuration, database, number of courses and user volume.
Optimized queries
Efficient calculation and visualization of indicators to reduce repetitive manual operations.
Efficient database usage
Prepared queries designed to minimize unnecessary load and support aggregated information views.
Non-intrusive reads
A consultation and visualization model designed not to interfere with users’ regular work.
Every institution has different needs. Board Retention allows indicators, filters and views to be adjusted to each academic monitoring model.
Deploy Board Retention step by step: validate the technical setup first, then configure indicators and finally support team adoption.
Install Board Retention as a Moodle plugin and review compatibility, permissions and environment before deployment.
Result
Technical baseline ready for the pilot.
Define which data you need to visualize and which criteria are relevant for academic monitoring.
Result
KPIs aligned with your educational model.
Test the solution with teachers or coordinators alongside native reports, without sudden workflow changes.
Result
Real validation before wider deployment.
Gradually extend usage to more courses or teams while keeping the transition controlled and measurable.
Result
Gradual adoption with lower friction.
Native Moodle reports remain available during the transition, so the change can be gradual and controlled.
See how to centralize KPIs, exports and scheduled reports for teachers, coordinators and academic leaders.