Academic coordination with global visibility and traceable data
Monitor courses and groups in one view, prioritize teacher support, and run institutional follow-up with shared criteria.
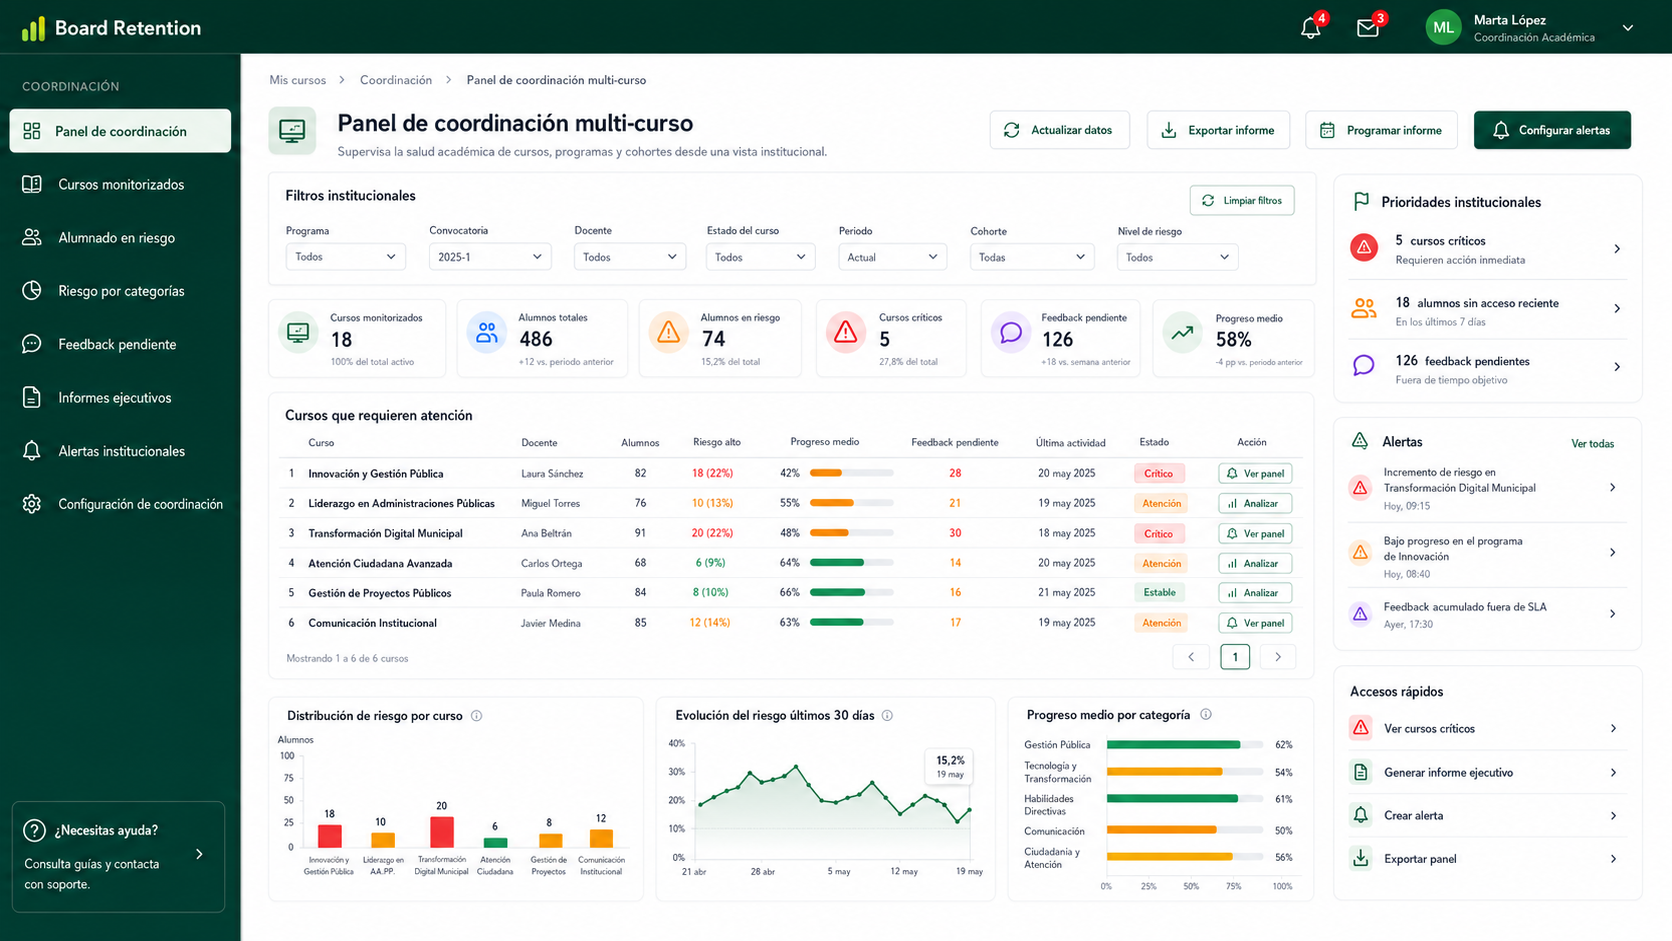
Agregados multi-curso con KPIs globales, ranking de cursos y filtros por categoría.
Supervise with context. Prioritize with clarity. Report with evidence.
Centralized pedagogical observatory
Informed leadership: multiple courses in one dashboard. Detect where risk is growing, which courses need support, and where teams need reinforcement. Move from perception-driven decisions to comparable course data.
Executive reports that drive continuous improvement
Data that tells stories: automated monthly summaries with progress trends, at-risk courses, and pending feedback load. Export by teacher, program, or cohort and bring evidence-based follow-up to academic meetings.
Contextual teacher support. Not criticism, solutions.
Data-driven coaching: when Teacher X has at-risk students, contact them with numbers (not judgment). 'Your Course Y has 15 students at abandonment risk; here's Board Retention to help.' You turn data into support, not surveillance. Teachers collaborate. Everyone improves.
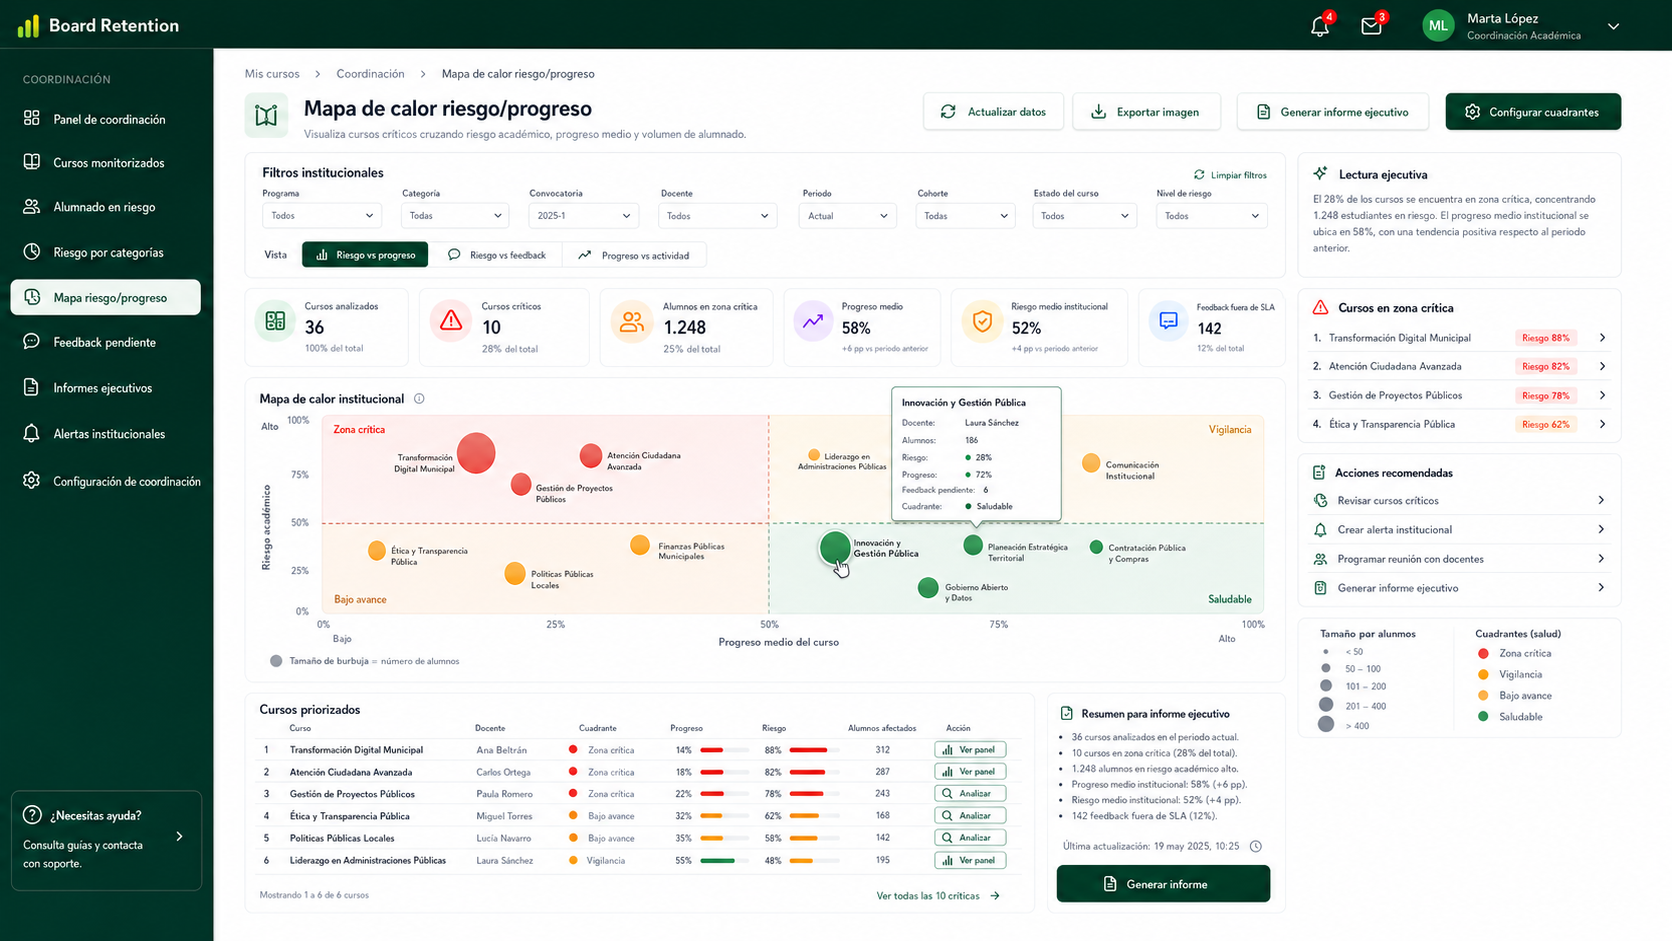
Visualización ejecutiva de riesgo y progreso por curso con tooltip y acceso a detalle.
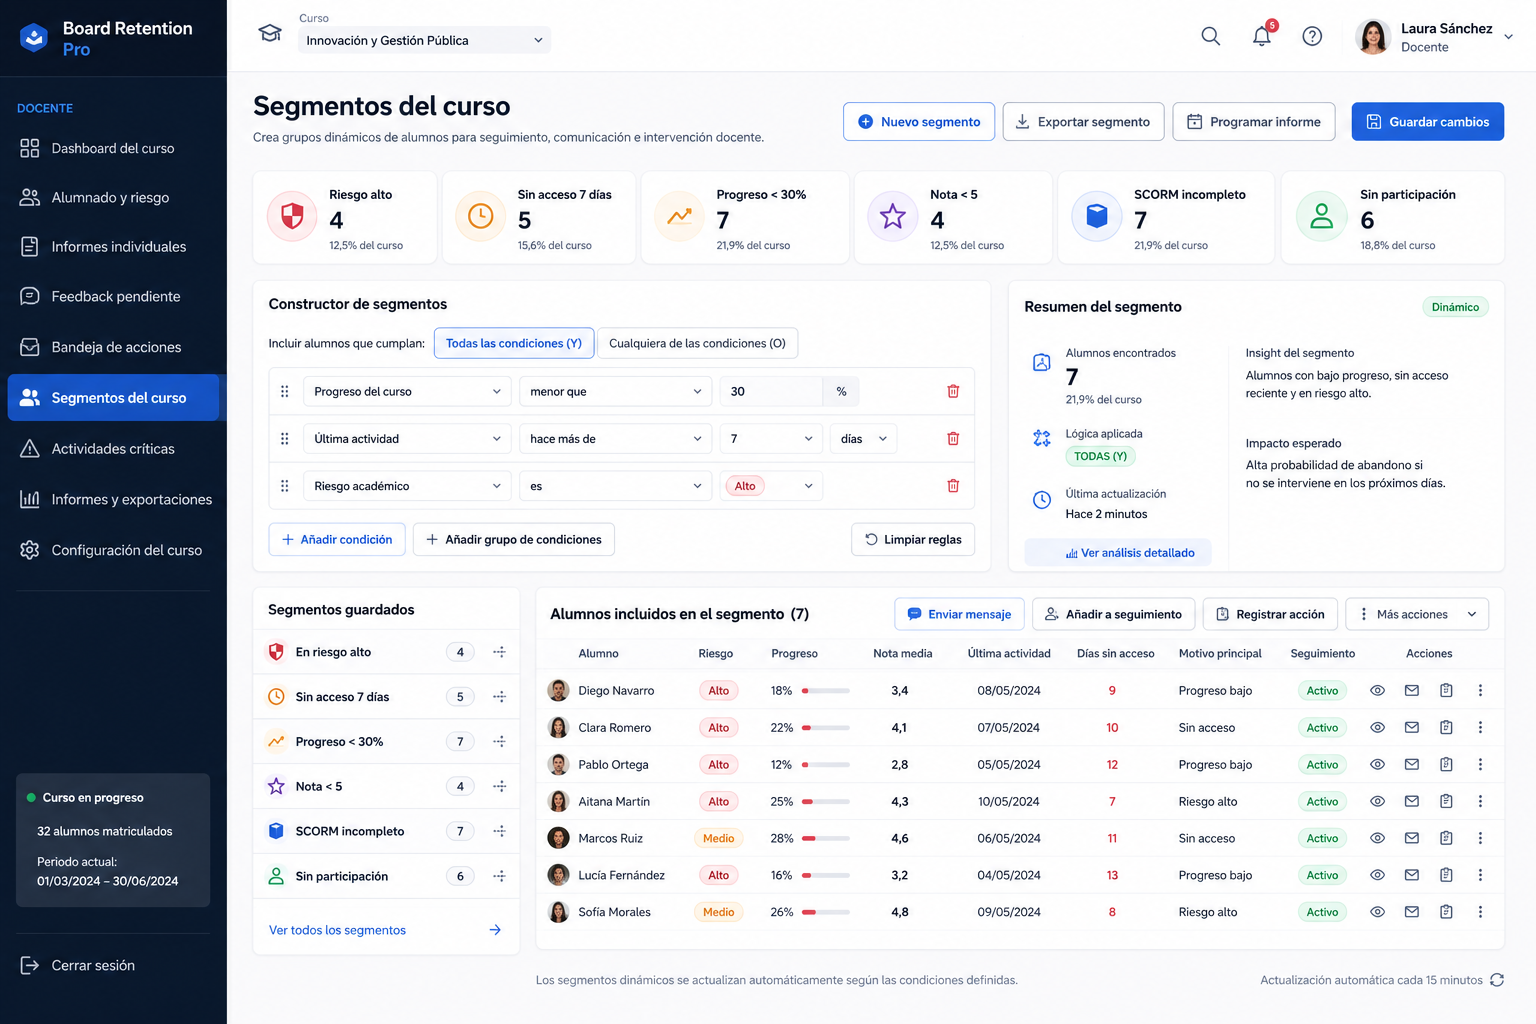
Segmentos predefinidos y constructor visual de condiciones para filtrar alumnado.
Consolidate institution-wide academic follow-up.
One executive view to coordinate decisions and improvement plans.
Frequently Asked Questions
How do I convince teachers this isn't surveillance?
Frame it right: 'Board Retention is a tool to support you, not monitor you.' Data is for you and to ask for help. Show real cases where Board Retention helped teachers save students.
Do I have to review the dashboard daily?
No. Set up automatic weekly/monthly reports. Most coordinators review 2x per week. Data is there when you need it.
Can I see what each teacher does or what data they access?
No, nor should we. We respect teacher privacy. You see only learning metrics (progress, risk, grades). Not 'Teacher X accessed 4 times'.
How do I report results to leadership?
Generate executive reports with at-risk courses, progress trends, pending feedback load, and period evolution. Export to PDF for formal presentations.
Does it work if we have teachers who resist digital tools?
Yes. Coordinator and admin see data the same way. Reluctant teachers can choose not to use the panel, but performance data is still available for institutional support.