Understand how your students learn
Learning Analytics inside Moodle. Analyze progress, engagement, completion, and early risk signals without external data.
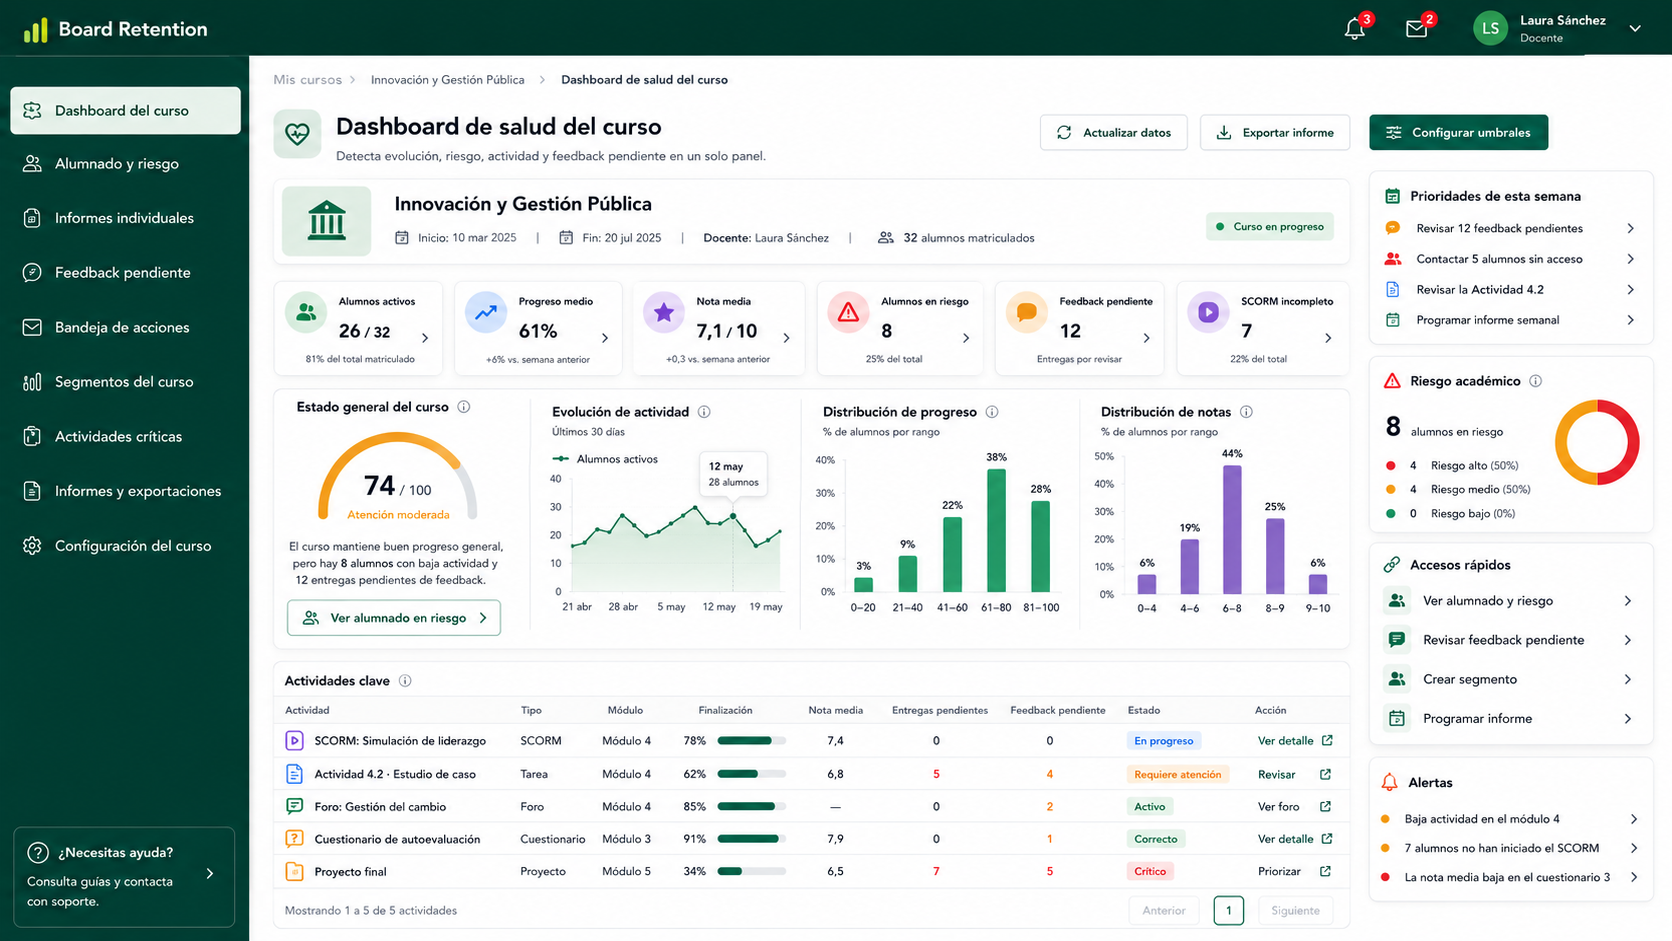
Panel único con KPIs del curso: progreso, actividad, notas, feedback pendiente y SCORM.
What is Learning Analytics?
Learning Analytics is the analysis of academic data to understand and optimize the learning process. Board Retention by EDF brings it directly to your Moodle.
Key Metrics
Progress
Activities completed vs expected. Advancement rate per week.
Engagement
Forum participation, on-time submissions, task completion.
Completion
% of activities completed. Rates by activity type.
Time Spent
Hours on platform per student and per activity.
Grades
Average, trends, peer comparison.
Engagement Score
Combined engagement score from multiple metrics.
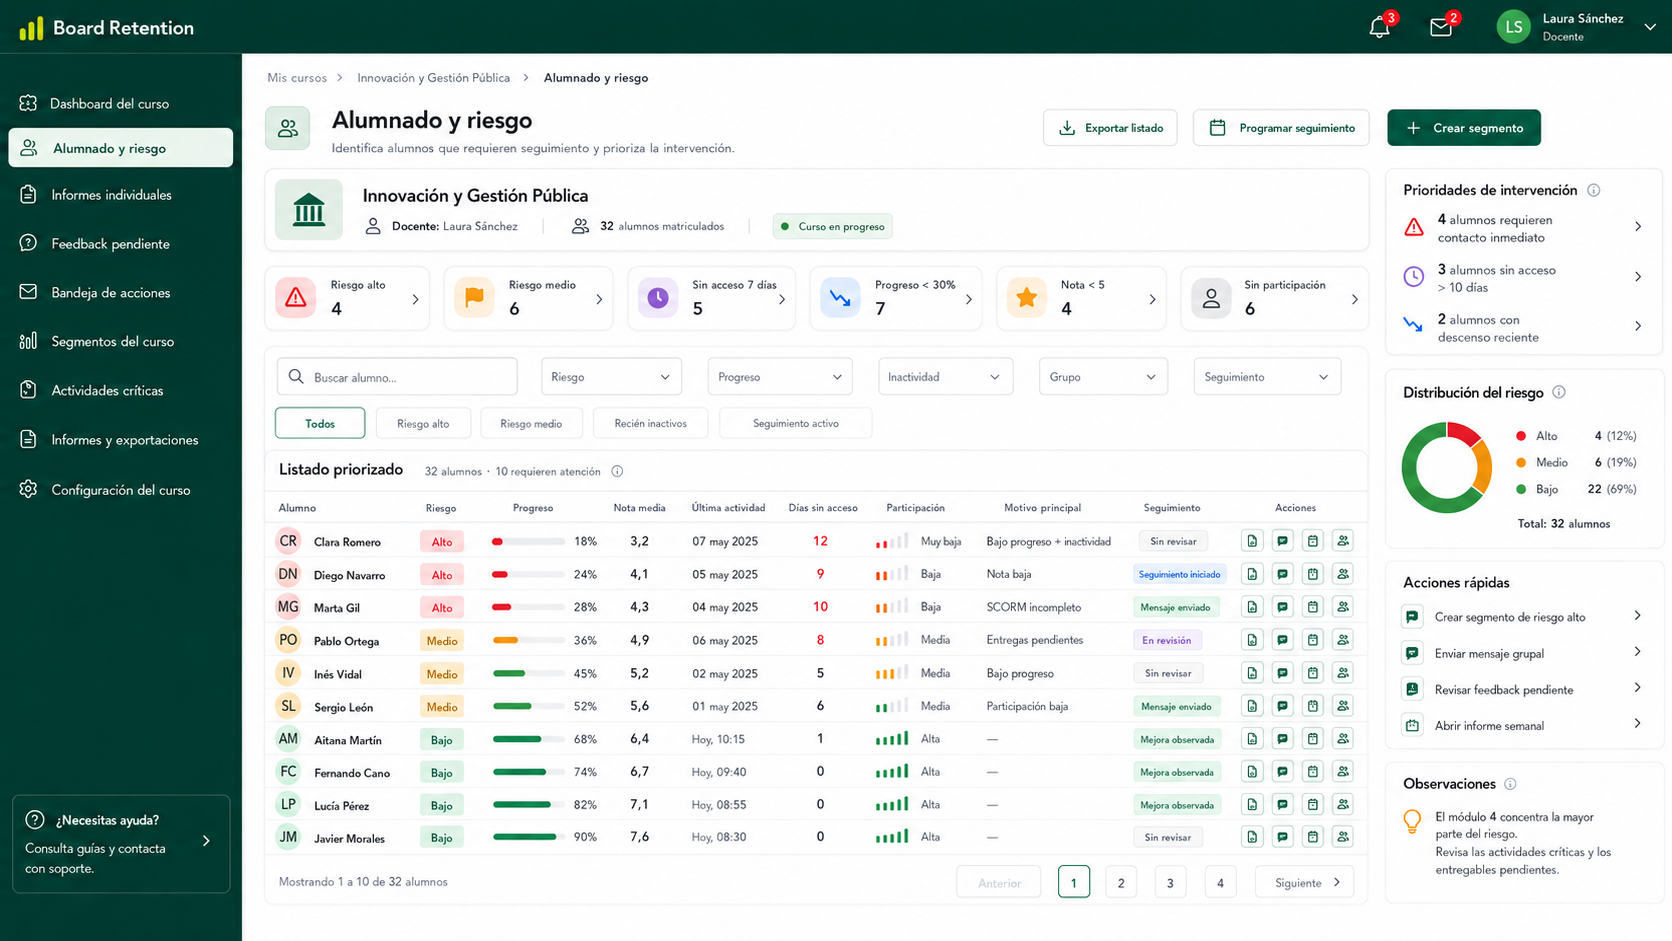
Listado accionable con indicadores de riesgo, progreso y última actividad por alumno.
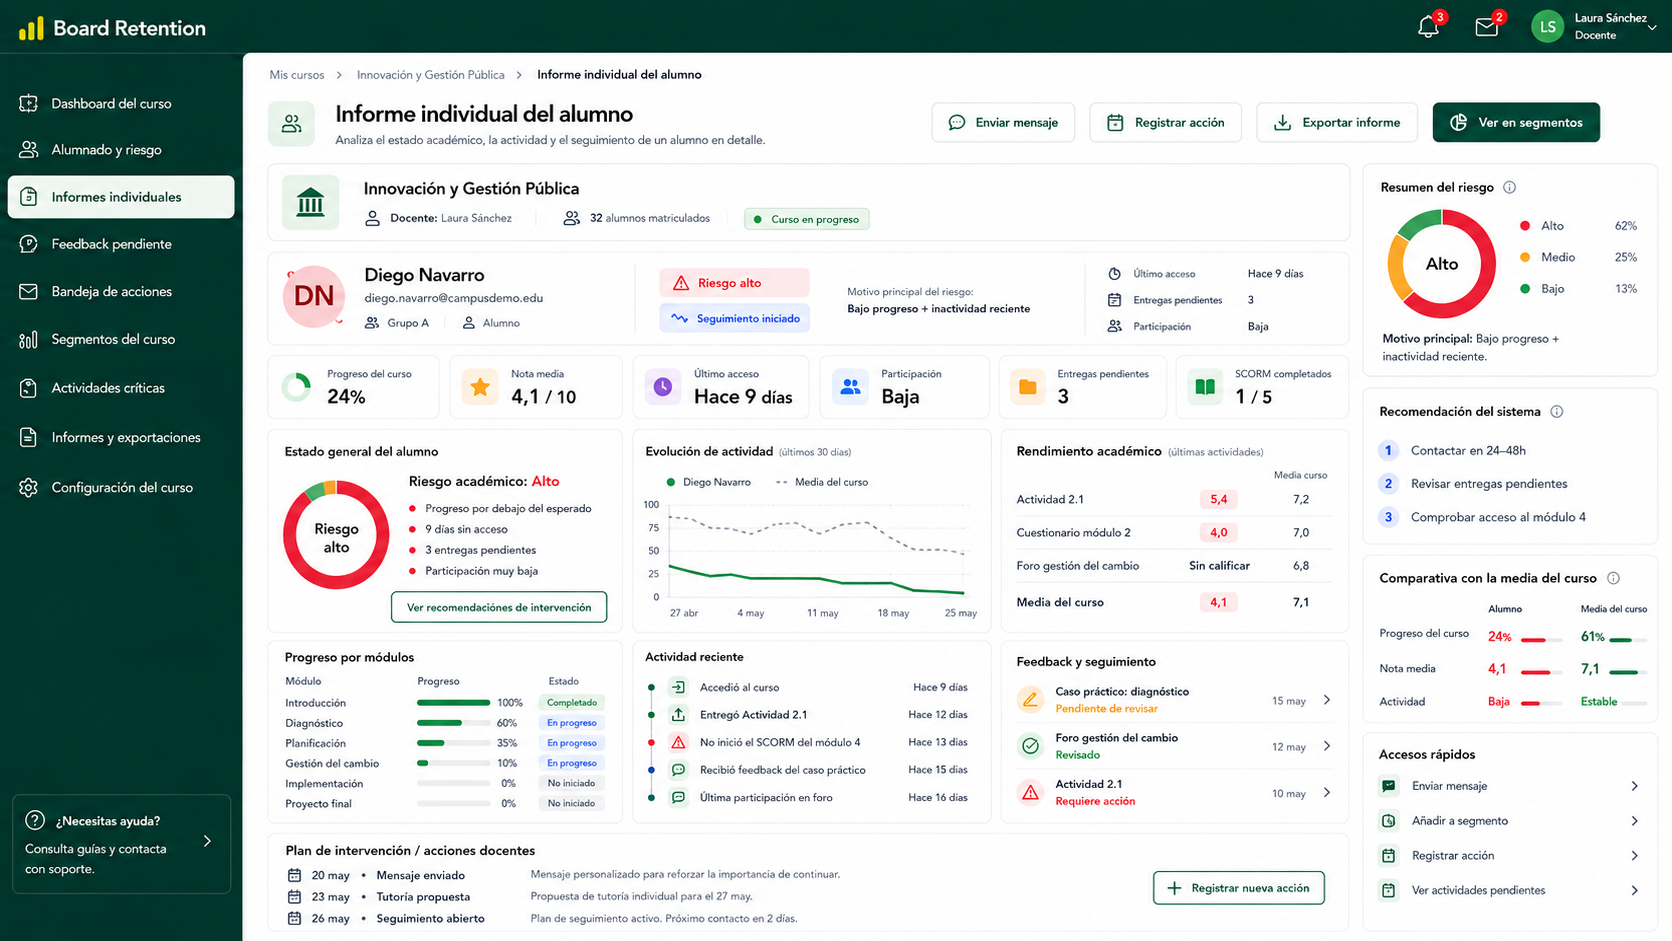
Ficha completa del alumno con progreso, notas, actividad, feedback y contexto de riesgo.
Benefits
Understand what strategies work best
Identify which activities, materials, and pedagogical approaches generate the most engagement and better results. Optimize your teaching based on data, not intuition.
Adjust course difficulty in real-time
Detect when content is too easy or too difficult by observing progress patterns. Intervene quickly to maintain the optimal balance of challenge.
Identify students who need support
Early risk signals (inactivity, low progress, no participation) appear before low grades. Intervene proactively before the student falls behind.
Data-driven, not intuition-based
Every decision is backed by objective academic data from your Moodle. No guessing, no uncertainty. Evidence to justify your actions.
Change history and audit trail
Every report, export, and change is recorded. Complete audit trail for compliance and traceability of academic decisions.
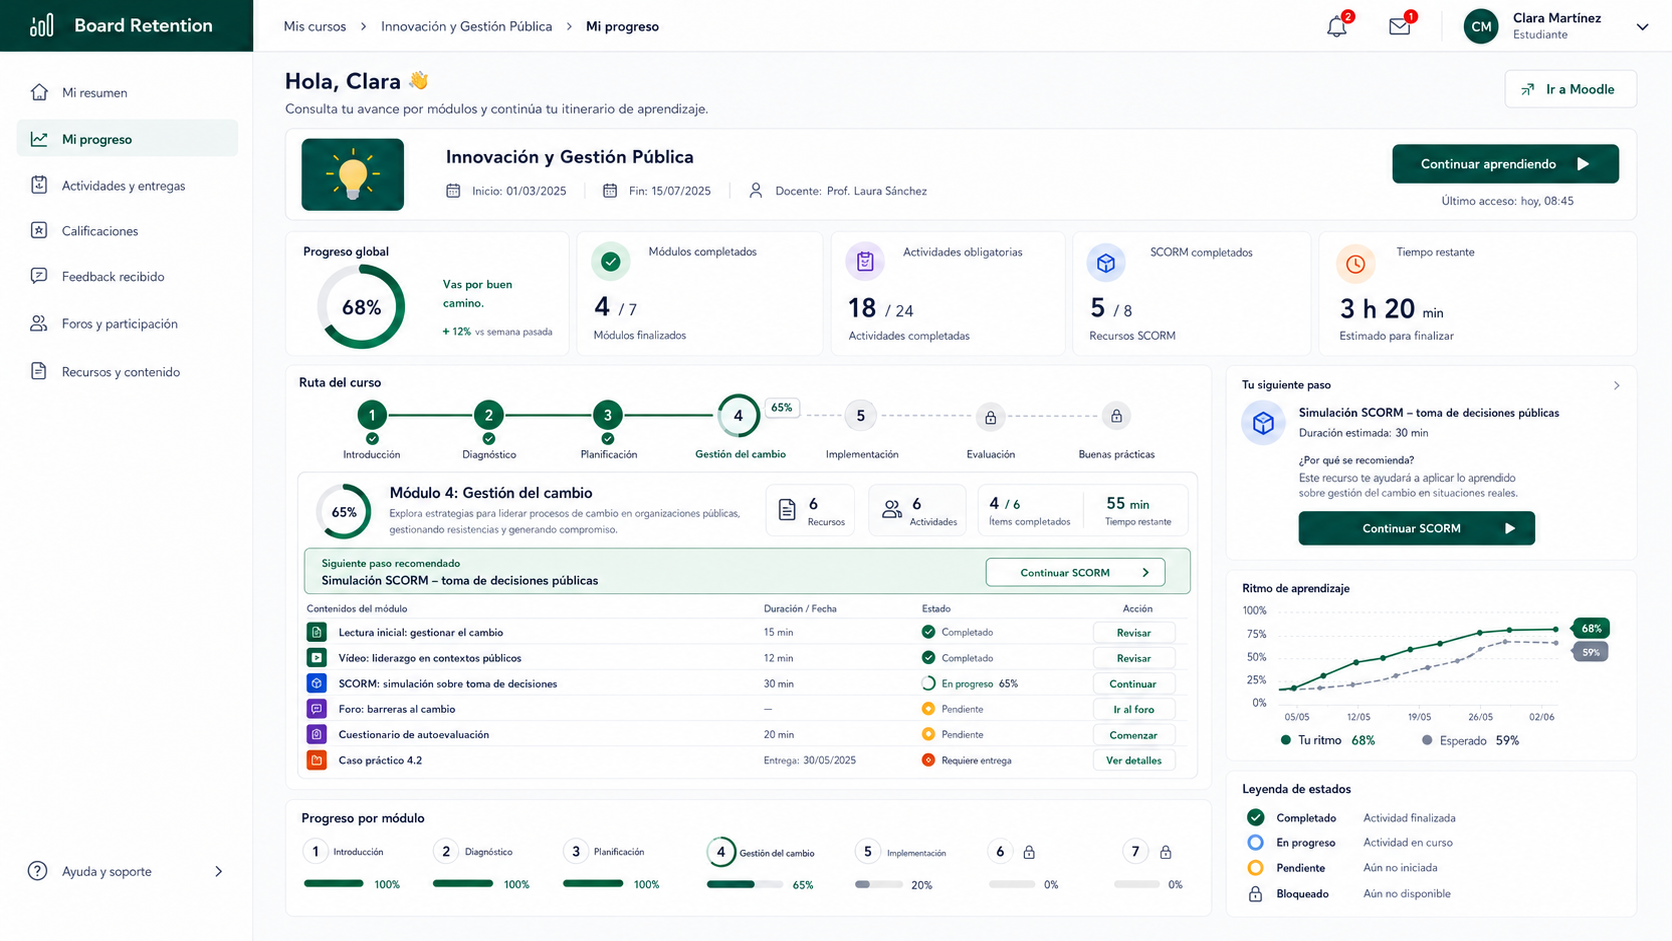
Ruta visual de aprendizaje con seguimiento por módulos, SCORM y actividades.
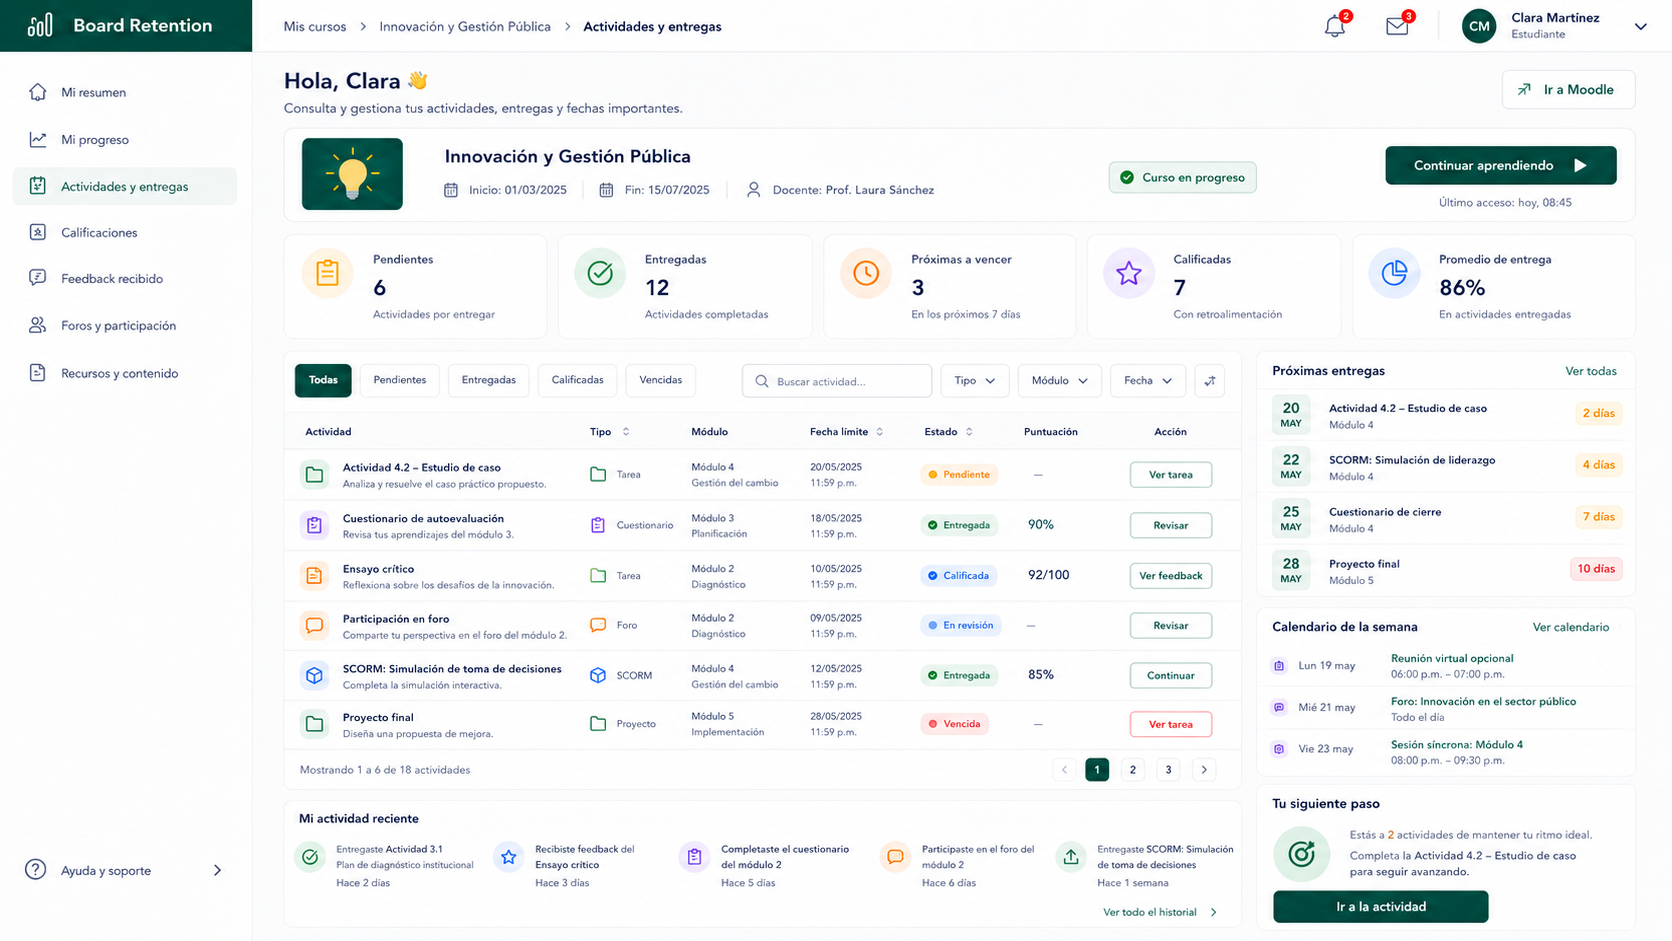
Vista única de trabajo pendiente con priorización de atrasadas y próximas entregas.
Data Types Analyzed
Everything inside your Moodle.
Activities
Complete analysis of all activity types: assignments, SCORM, quizzes, forums, and surveys. Records submission dates, number of attempts, time spent per activity, and participation patterns for each task type. Identifies which activities generate the most engagement and which students avoid.
Grades
Scores from all activities, categories, and Moodle scales. Grade change history, peer performance comparisons, and grade evolution throughout the semester. Detects trends (improvement, plateauing, decline) with automatic alerts when failure risk emerges.
Access and Sessions
Detailed logs of when, where, and how long each student accesses (day, time, device, IP). Identifies study patterns (early risers vs night owls), students who access but don't participate, and sudden changes in access frequency that signal problems.
Course Completion
Activity completion status according to Moodle's completion criteria. Which student completed what, when, and what criteria remain pending. Progress view by module, by activity type, and by student. Automatic alerts for students falling behind the expected schedule.
Use Cases
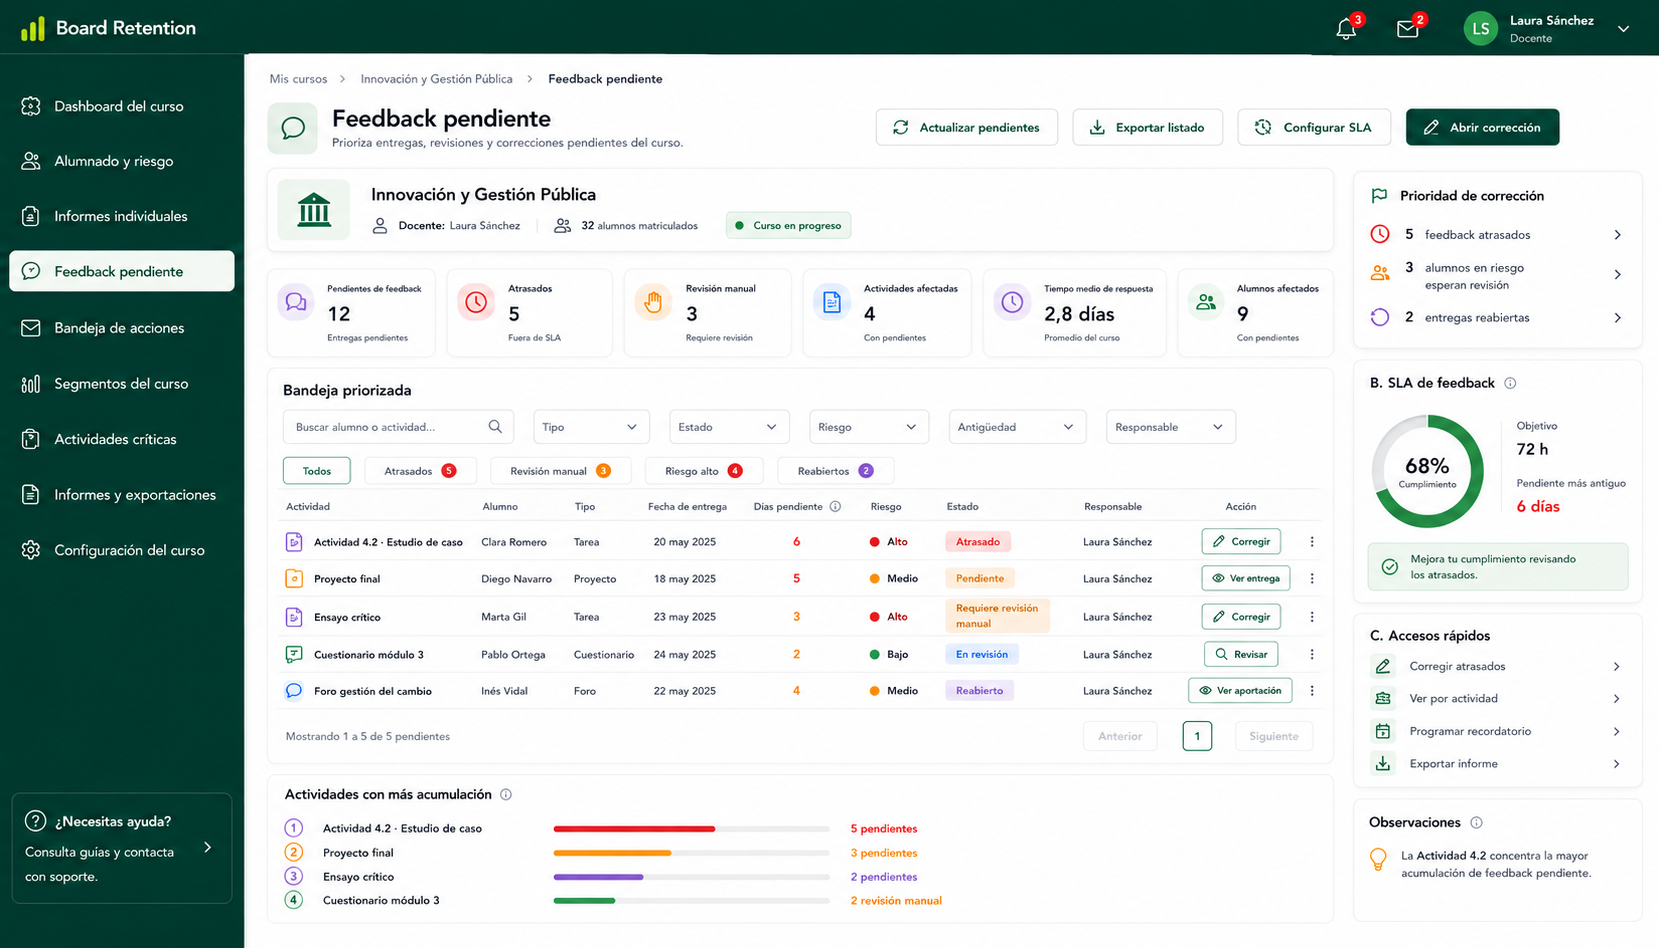
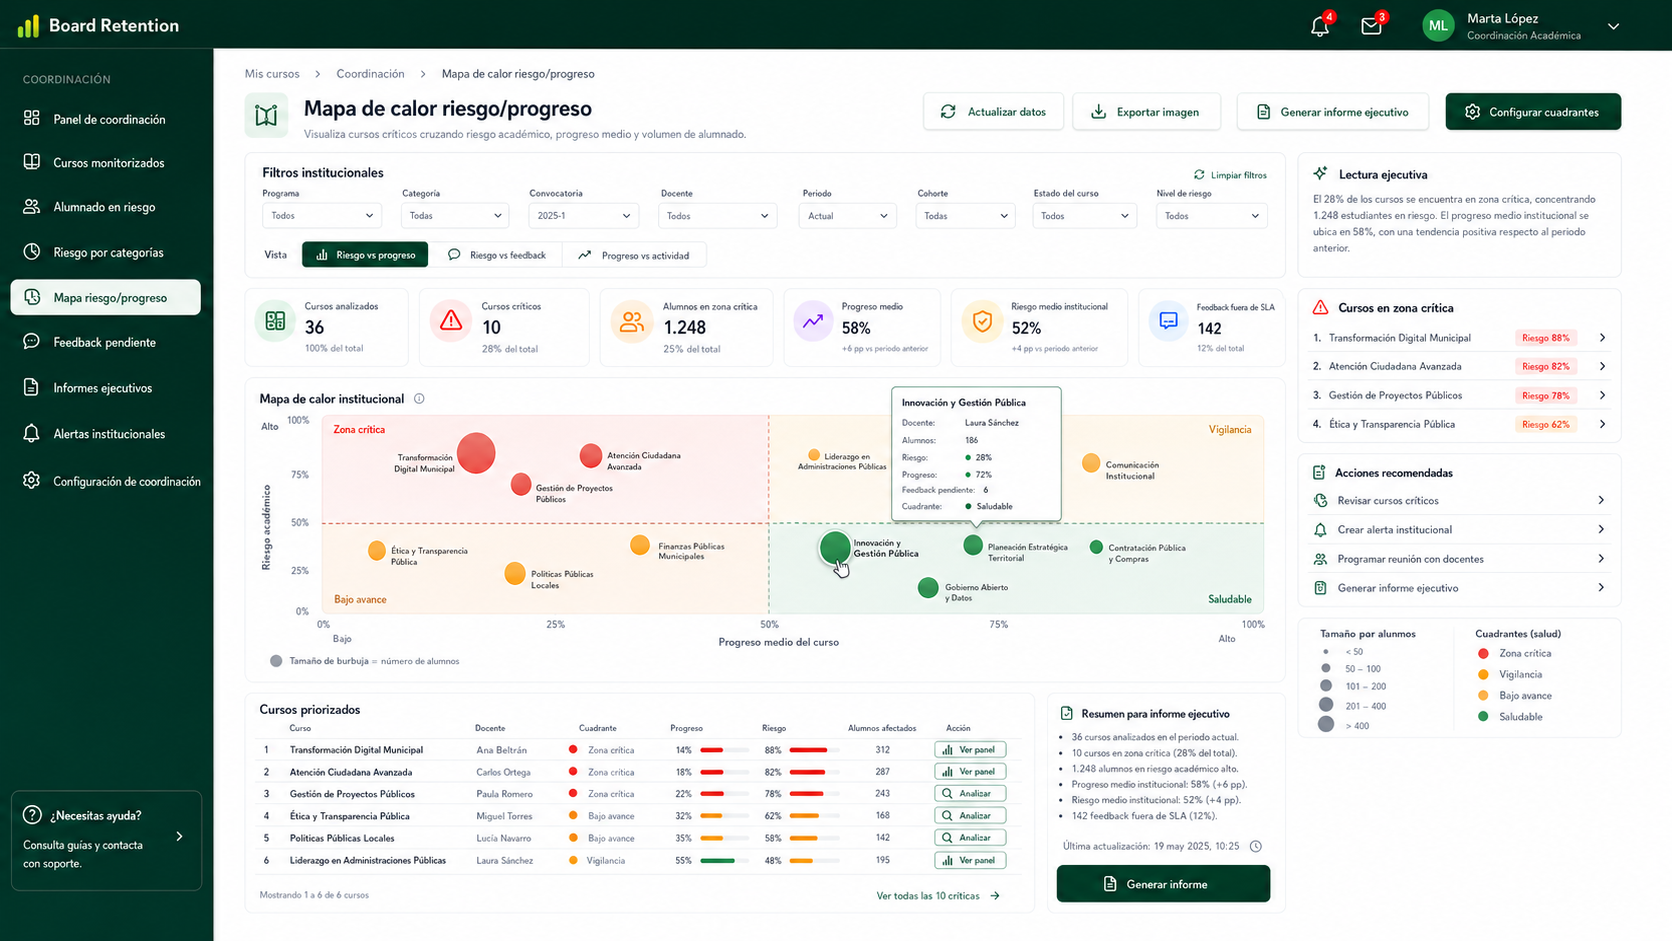
Turn Moodle data into academic decisions
Turn Moodle data into clear indicators for progress, engagement and academic monitoring.